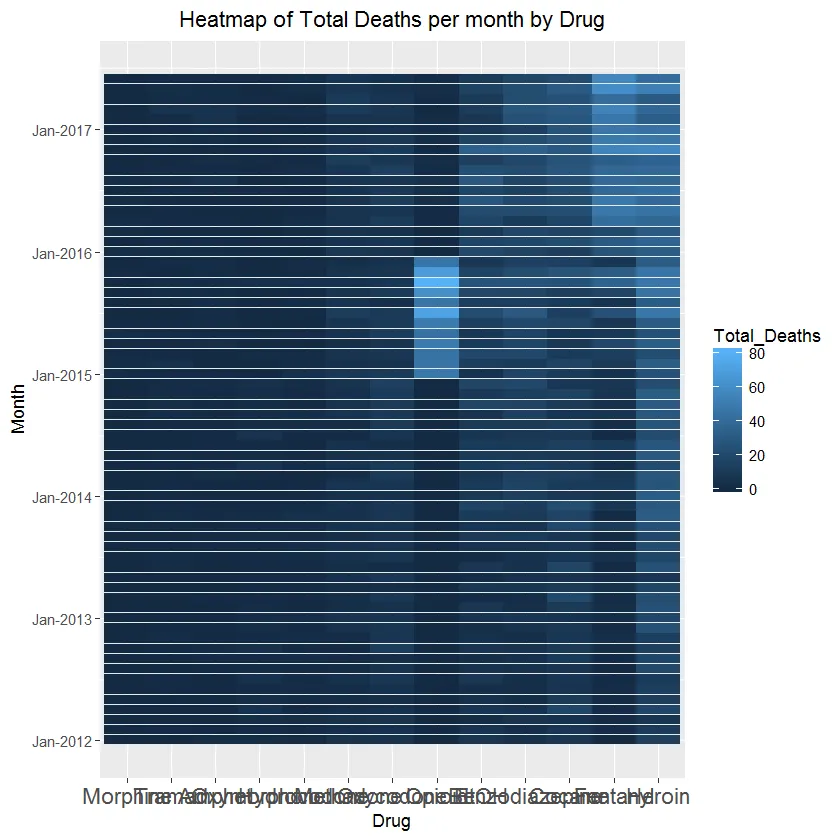
我在我的热力图中删除瓷砖之间的白线时遇到了问题。以下是我的代码和图片。有人遇到过这种情况吗?
t <- ggplot(Drug_heatmap_df_final,
   aes(x=reorder(Drug,Total_Deaths), y=Start_Date, fill=Total_Deaths)) +
   geom_tile() +
   labs(title="Heatmap of Total Deaths per month by Drug", x="Drug", y="Month") +
   theme(plot.title = element_text(hjust=.5)) +
   scale_y_date(date_breaks="1 year" , labels = date_format("%b-%Y")) +
   theme(axis.text.x = element_text(size=13))

plot(t)
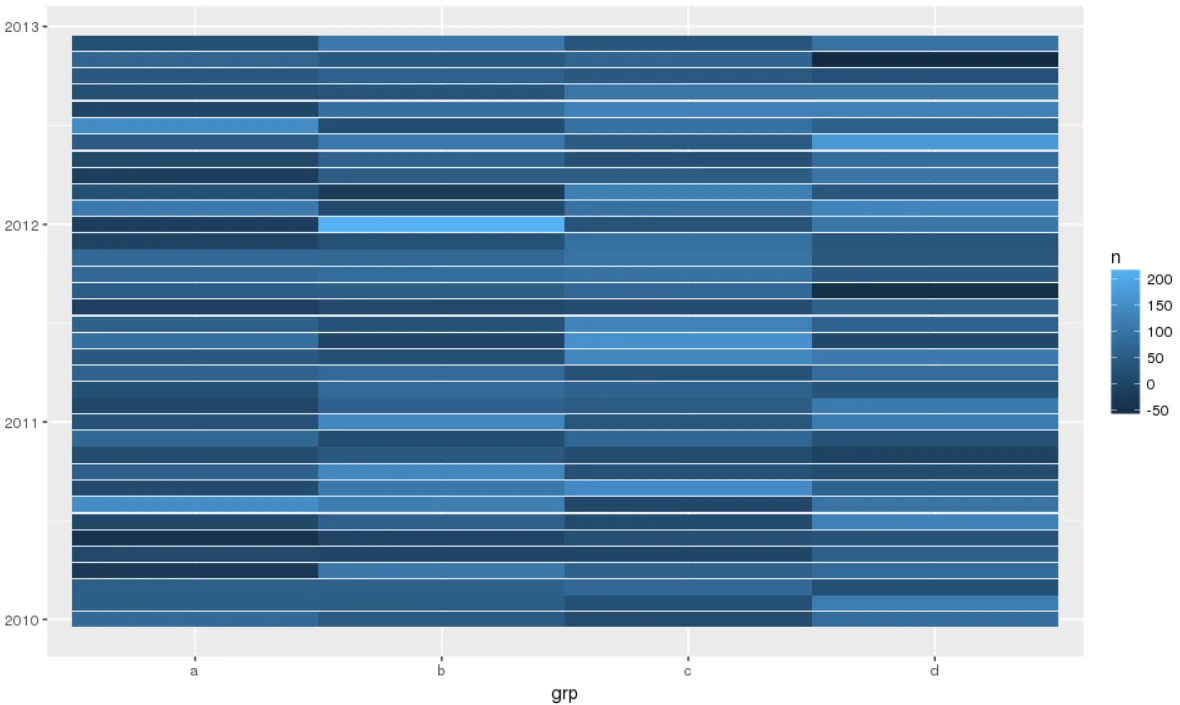
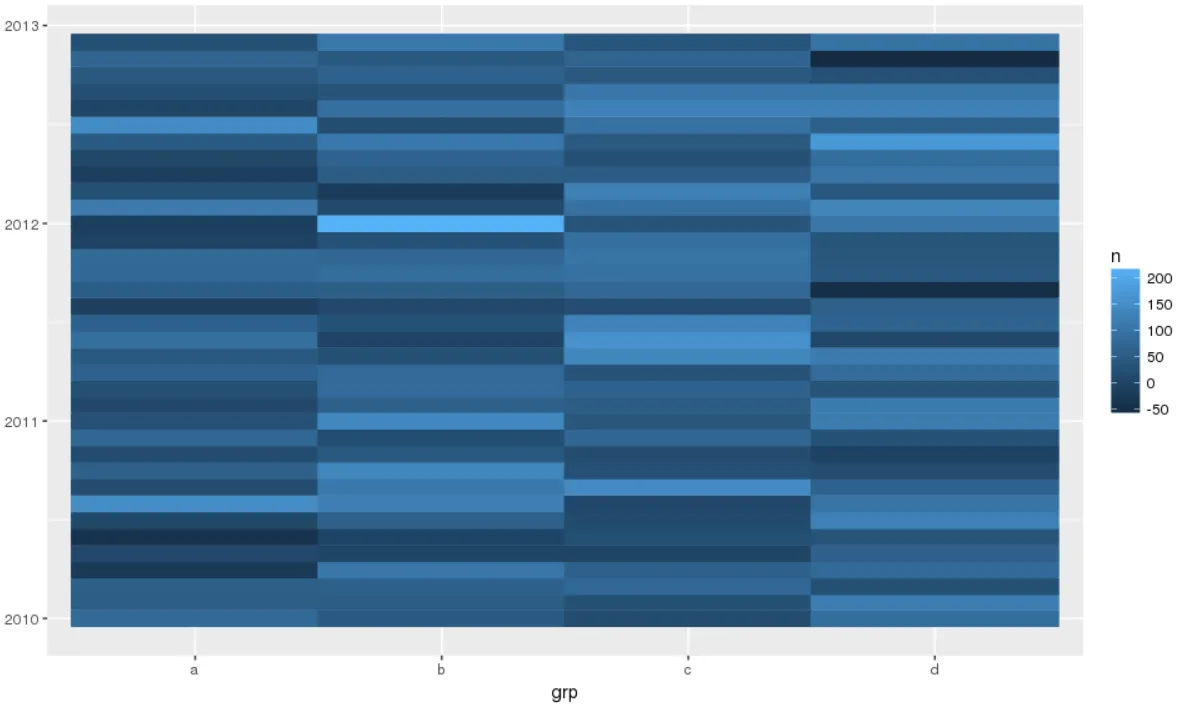
geom_tile(size= ...)对我没有任何改变。然而,我的y轴上没有日期,而是整数。对我有用的是geom_tile(height=1.01)。该值略大于默认值,也许默认值在日期y轴上不同。当条纹是垂直的时,可以类似地使用geom_tile(width=...)。 - akraf