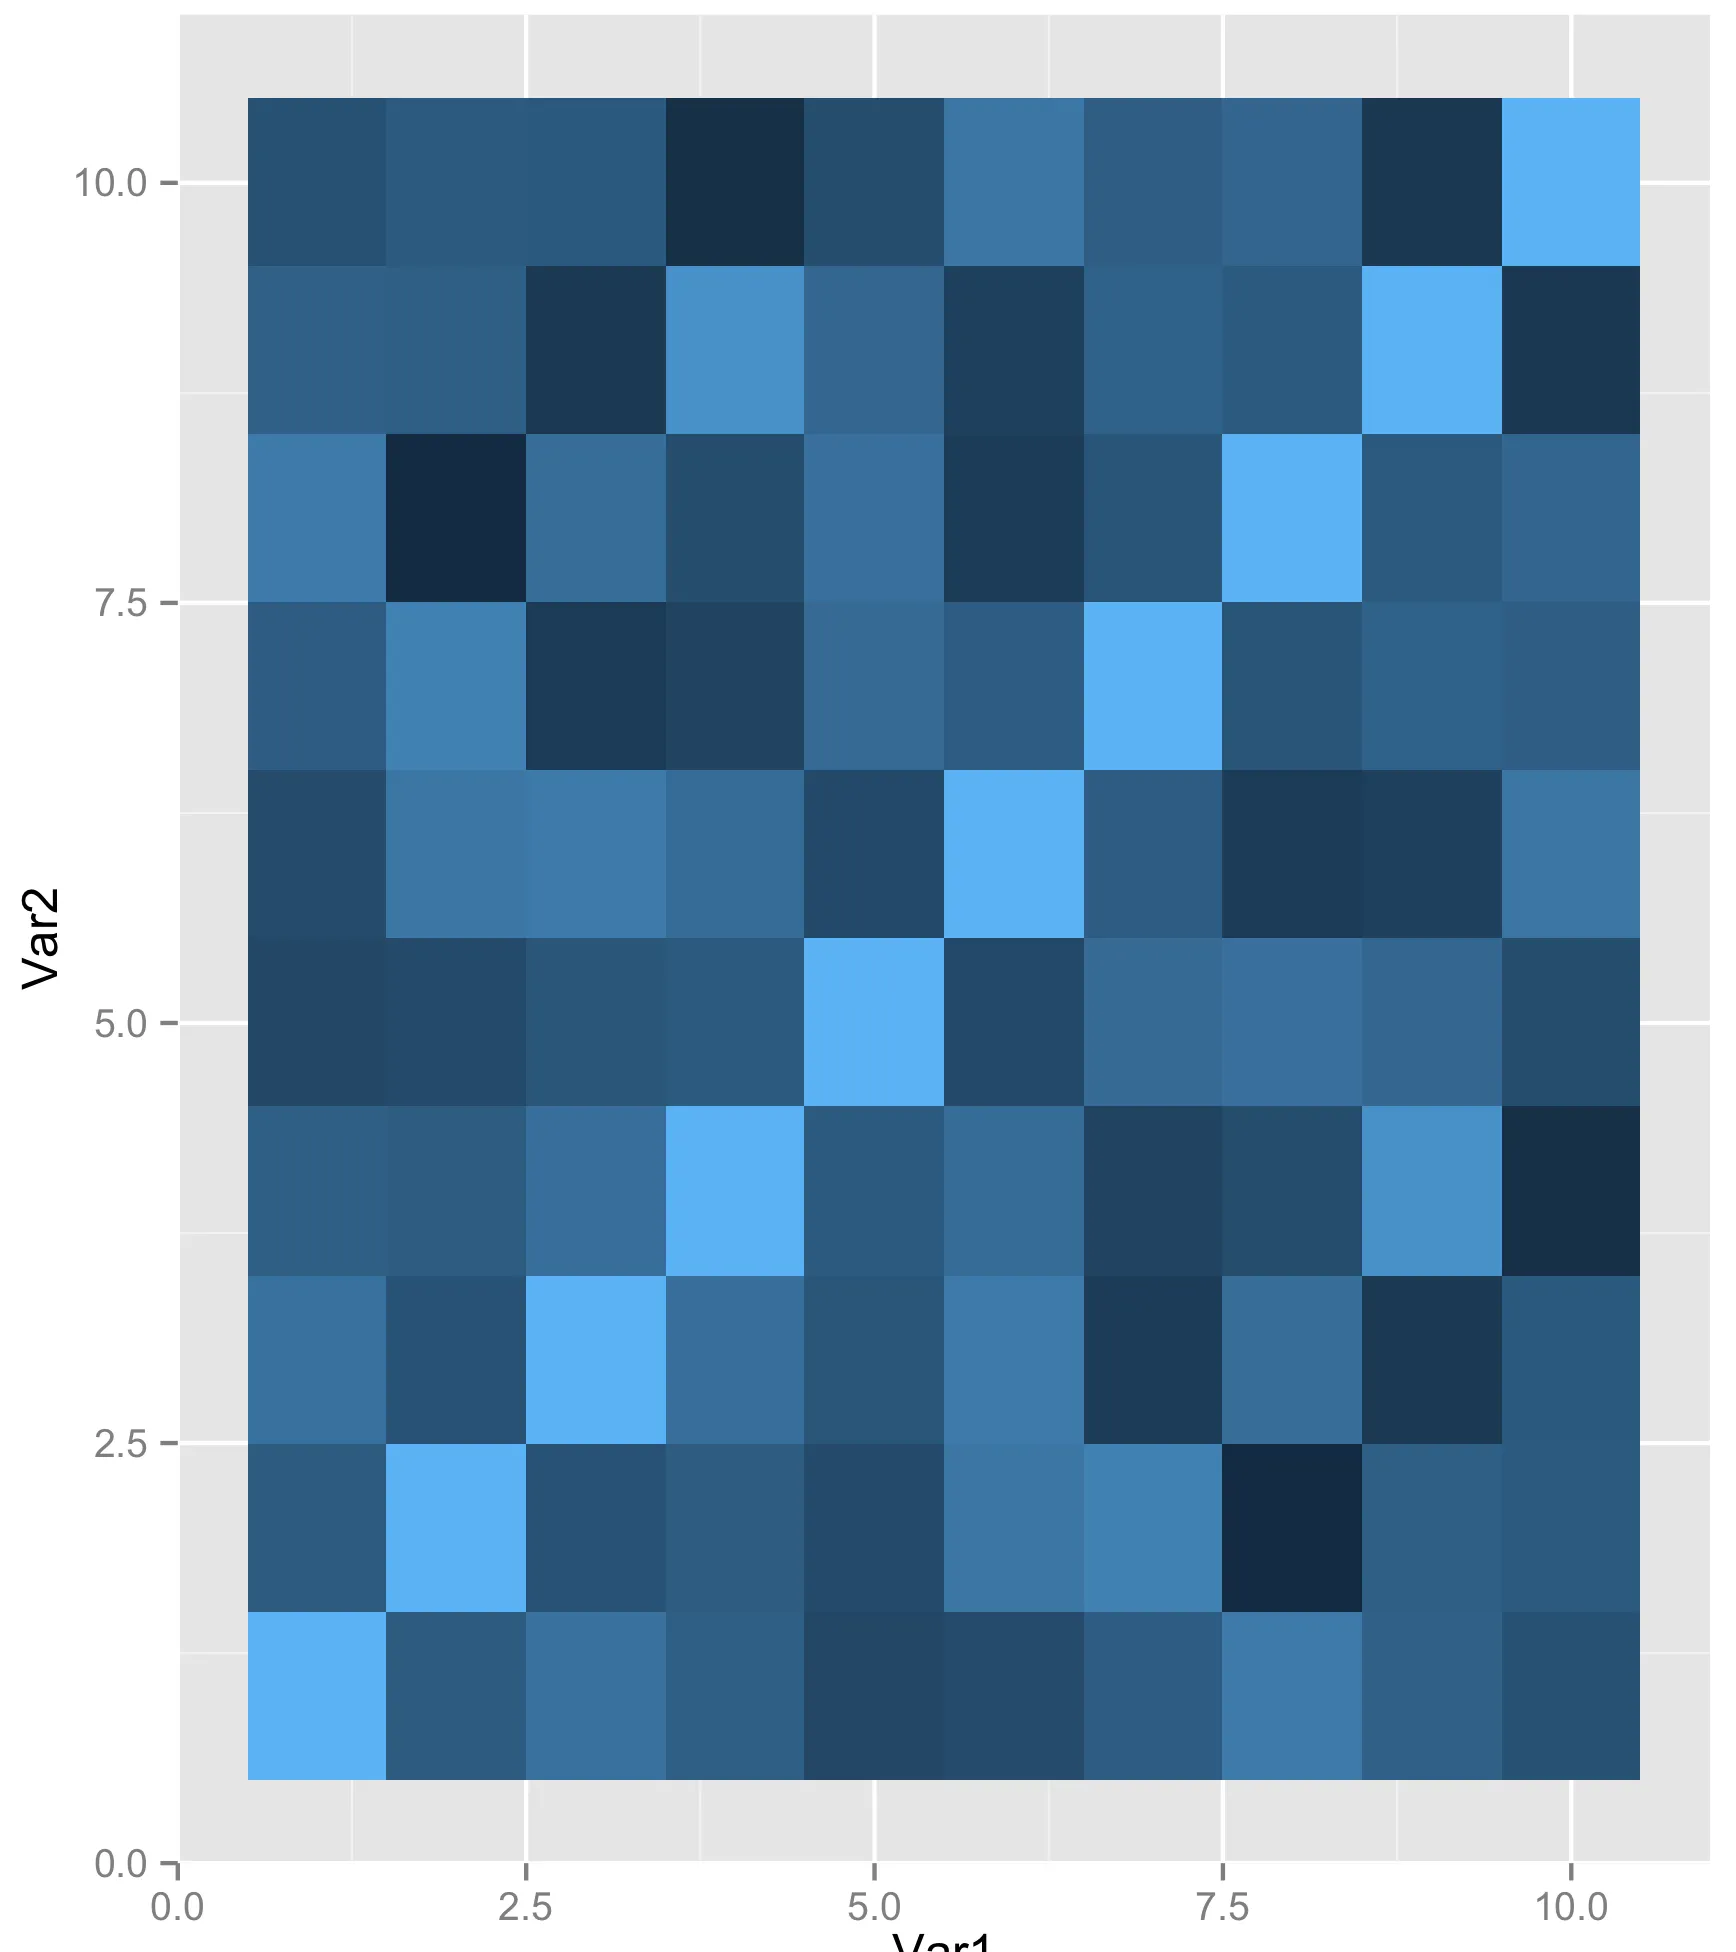
下面的代码生成从左下角到右上角的热图。
 。
。
library(ggplot2)
library(reshape2)
set.seed(111)

n <- 10
m <- matrix(rnorm(n^2), n, n)
m <- cor(m)
m <- melt(m)

ggplot(m, aes(Var1, Var2, fill = value)) +
    geom_tile()
。
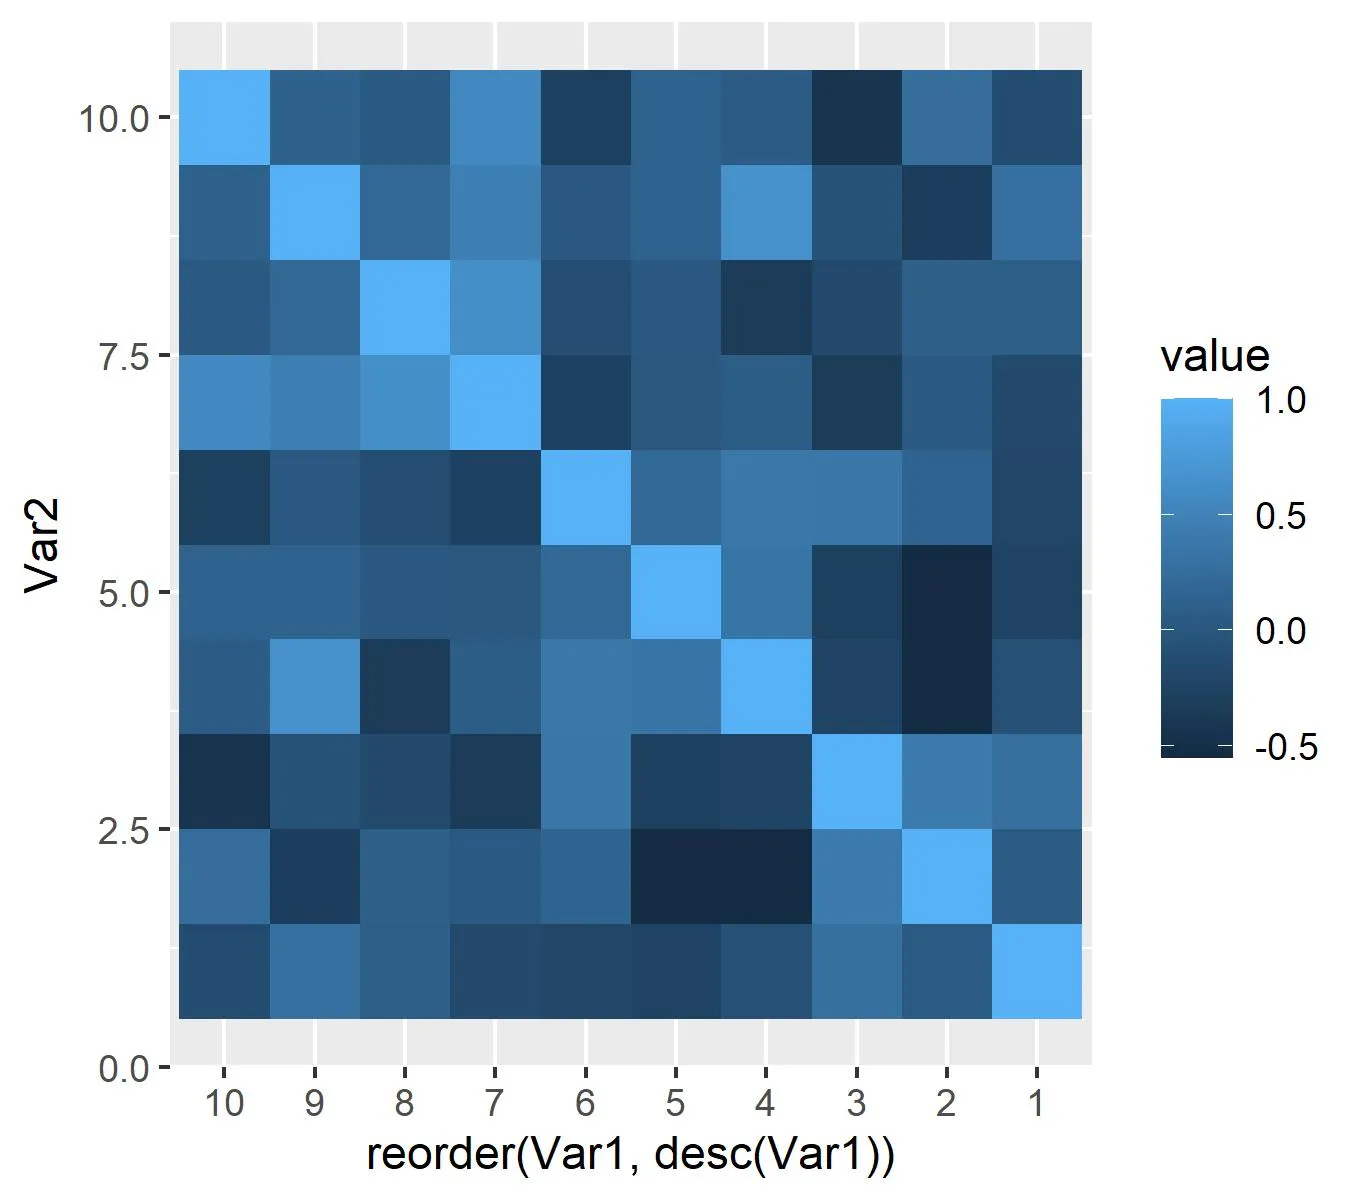
... aes(rev(Var1), Var2, fill = value) ...?还是+ scale_x_reverse()? - Axeman