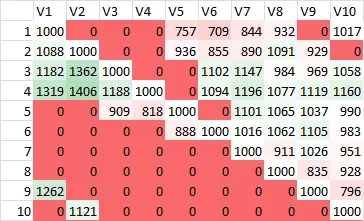
我曾经看过使用不同的 R 图形系统(包括 lattice 和 base)制作的带有数值的热力图,就像这样:
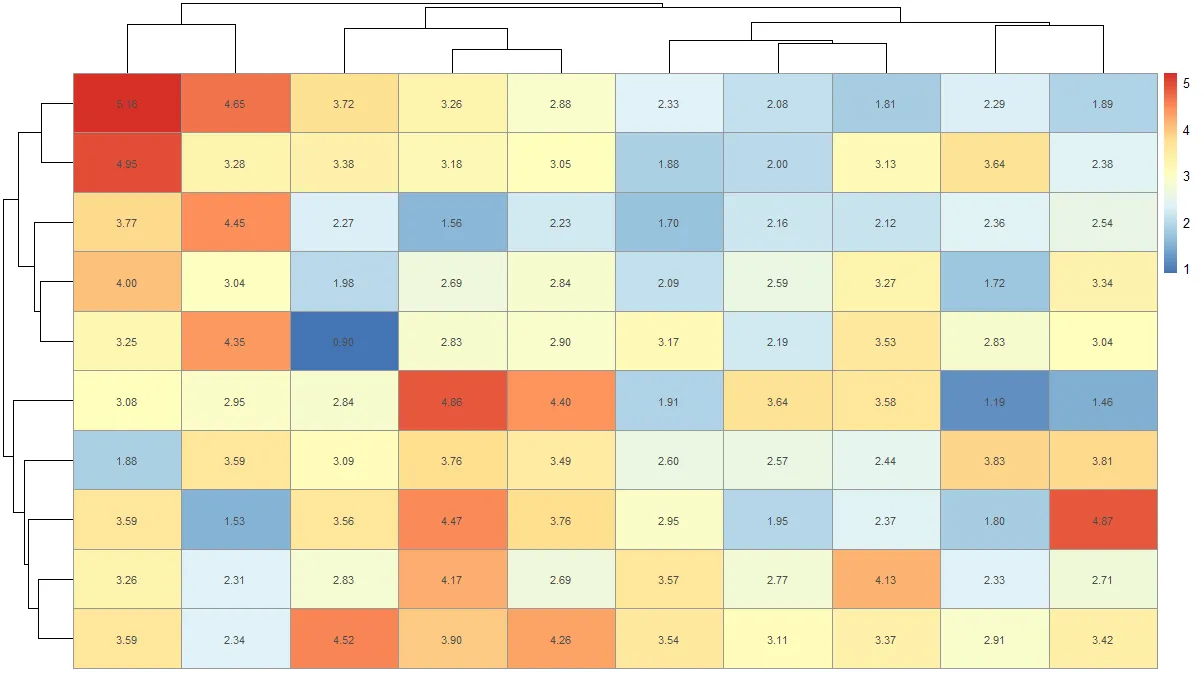
 我经常使用 ggplot2 并希望能够制作一个热力图,并在相应的单元格中绘制数值。以下是热力图及使用 geom_text 的尝试:
我经常使用 ggplot2 并希望能够制作一个热力图,并在相应的单元格中绘制数值。以下是热力图及使用 geom_text 的尝试:library(reshape2, ggplot2)
dat <- matrix(rnorm(100, 3, 1), ncol=10)
names(dat) <- paste("X", 1:10)
dat2 <- melt(dat, id.var = "X1")
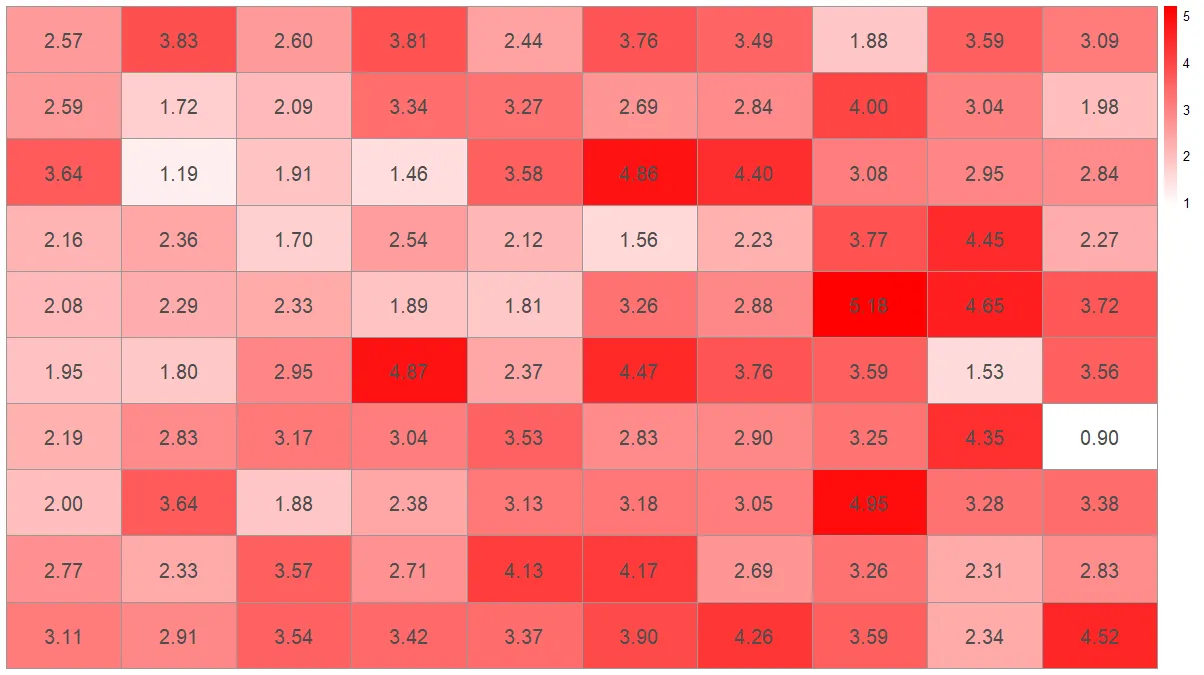
p1 <- ggplot(dat2, aes(as.factor(Var1), Var2, group=Var2)) +
geom_tile(aes(fill = value)) +
scale_fill_gradient(low = "white", high = "red")
p1
#attempt
labs <- c(apply(round(dat[, -2], 1), 2, as.character))
p1 + geom_text(aes(label=labs), size=1)
通常情况下,我可以确定要传递的 x 和 y 值,但在这种情况下我不知道,因为此信息未存储在数据集中。我该如何将文本放置在热力图上?

heatmap.2。参考类似的帖子 https://dev59.com/G2865IYBdhLWcg3wfeqU - Puriney