我想在ggplot2中制作一个热图。我的示例数据和代码如下:
set.seed(12345)
dat <-
data.frame(
Row = rep(x = LETTERS[1:5], times = 10)
, Col = rep(x = LETTERS[1:10], each = 5)
, Y = rnorm(n = 50, mean = 0, sd = 1)
)
library(ggplot2)
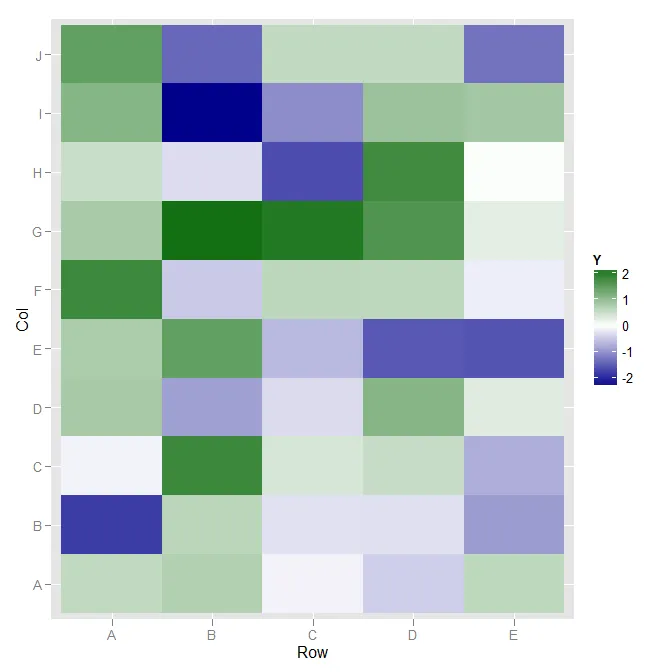
p <- ggplot(data = dat, aes(x = Row, y = Col)) +
geom_tile(aes(fill = Y), colour = "white") +
scale_fill_gradient(low = "white", high = "steelblue")
p
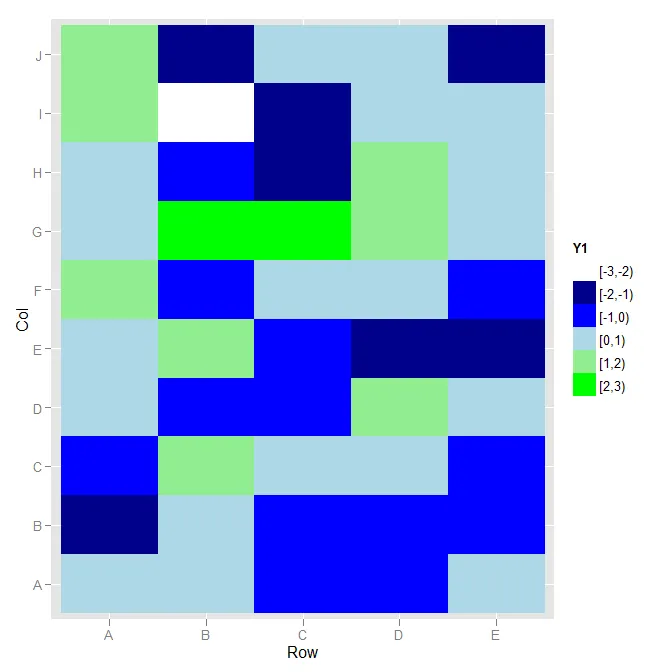
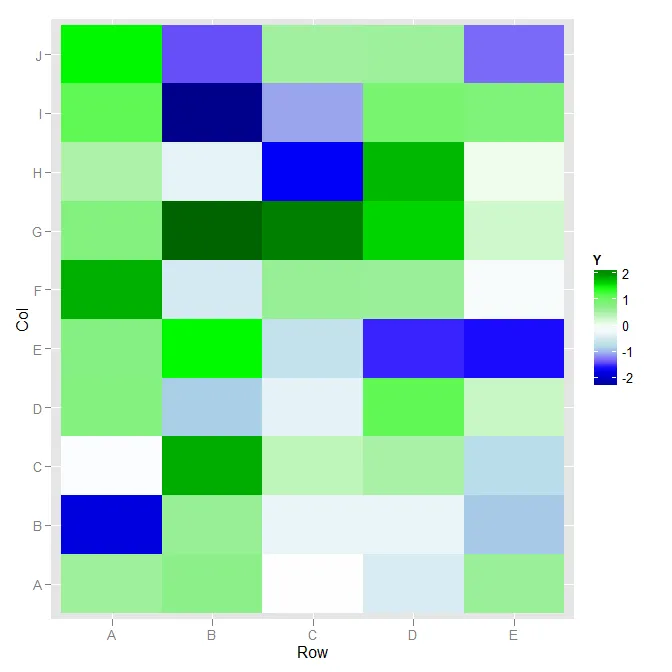
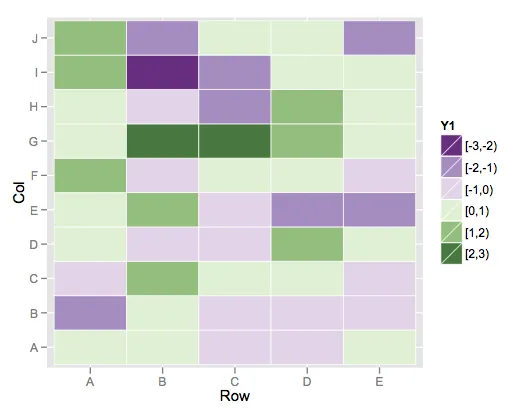
我想要像这样针对数值范围设置颜色方案:
-3 <= Y < -2  ---> Dark Blue
-2 <= Y < -1  ---> Blue
-1 <= Y <  0  ---> Light Blue
 0 <= Y <  1  ---> Light Green
 1 <= Y <  2  ---> Green
 2 <= Y <= 3  ---> Dark Green
\可以解决问题。考虑到这个答案已经六年了,很可能代码六年前能够工作,但现在却因R或ggplot2或其他任何更新而出现错误。 - fabern