在ggplot2热图中添加树状图

4

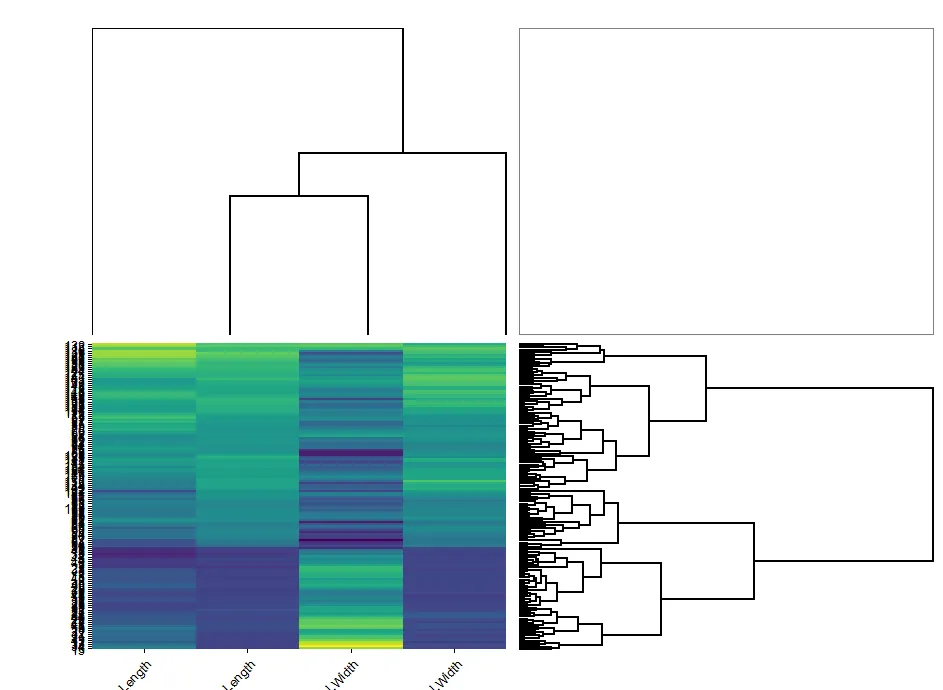
我是一名新的R用户。我正在尝试在使用ggplot2创建的热力图中添加一个树状图。我该怎么做?我已经将我的代码添加到了下面的热力图中。

#Mtcars using ggplots and reshape2 
install.packages("ggplot2")
library(ggplot2)
intall.packages("reshape2")
library(reshape2)
data(mtcars)
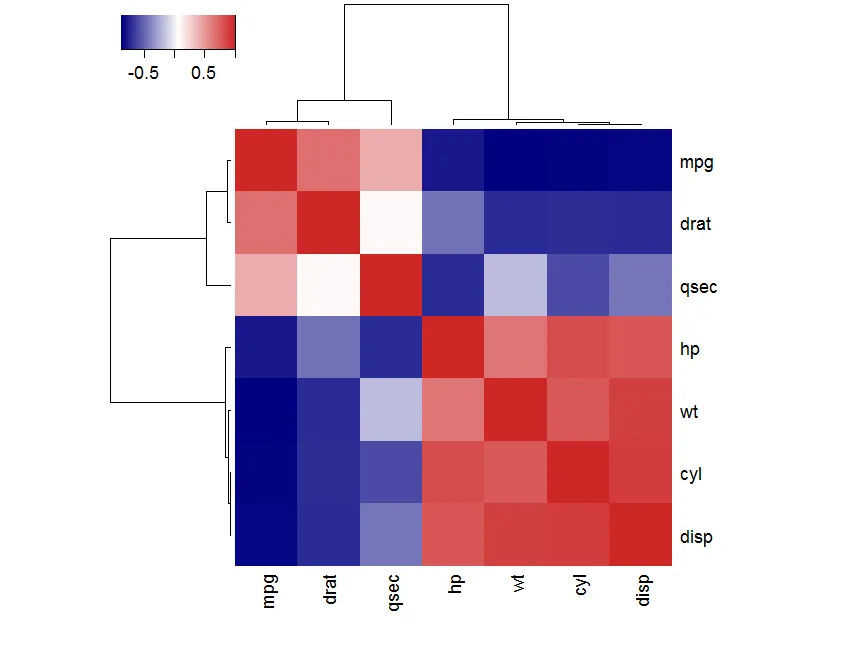
Cars <- mtcars[c(1:7)] #subset to 6 genres

cor(Cars) # 6x6 cor matrix

#ggplot likes the data 'melted' one value per row
m <-melt(cor(Cars)) 
p <- ggplot(data=m, aes(x=Var1, y=Var2, fill=value)) + geom_tile()
p

#set up a coloring scheme using colorRampPalette
red=rgb(1,0,0); green=rgb(0,1,0); blue=rgb(0,0,1); black=rgb(0,0,0)
RtoBrange<-colorRampPalette(c(red, black ) )
BtoGrange<-colorRampPalette(c(black, green) ) 

p <- p + scale_fill_gradient2(low=RtoBrange(100), mid="black",           high=BtoGrange(100))
p

感谢您的帮助,

夏洛特


2
也许 ggdendro 包可以帮助你完成这个任务? - Warner
2
这里有一个很好的例子,使用ggdendroplotly进行展示,链接在这里:https://plot.ly/ggplot2/ggdendro-dendrograms/。 - Matt Sandgren
@MattSandgren 我建议你看看 dendextend。它有一个用于使用 ggplot2 创建树状图的分支,可以保留树的颜色和线宽等图形参数。请参见此处:https://cran.r-project.org/web/packages/dendextend/vignettes/introduction.html#ggplot2-integration - Tal Galili
3个回答

5
使用gplots包中的heatmap.2函数(https://cran.r-project.org/web/packages/gplots/gplots.pdf),该函数会自动将树状图添加到您的热力图中。使用您的示例:
install.packages("gplots")
library(gplots)

data(mtcars)
Cars <- mtcars[c(1:7)]

mycolors <- colorRampPalette(c("red", "black", "green"))
heatmap.2(cor(Cars), trace = "none", col = mycolors)

4
这有点棘手,因为并非所有的部分都准备就绪,但这是我在heatmaply中开始的工作目标。如果您想要与plotly一起创建带有树状图的交互式热力图,那么您应该查看heatmaply vignette
如果您对静态热力图感兴趣,我认为现有的软件包已经做得很好了,所以重复发明轮子可能没有意义。但如果这仍然是您想要做的事情,以下是主要步骤:
1.生成树状图对象 2.在ggplot2中绘制树状图对象 3.以尊重行(或来自树状图的列)顺序的方式创建热力图 4.合并对象。
第一步可以使用hclustas.dendrogram,第二步需要使用dendextend的[as.ggdend][2]函数。第三步可以使用heatmaply::heatmapr + heatmaply:::ggplot_heatmap(目前已隐藏,但将来会为此类事情展示出来)。第四步比较棘手,我迄今为止无法使其工作得“足够好”,因为元素的比例不好。
我将其封装成了一个新的ggheatmap函数,并将其上传到github上的heatmaply。但这需要更多的工作,所以我接受拉取请求。同时,以下是如何操作的:
devtools::install_github("ropensci/plotly") # you will probably benefit from the latest version of plotly
devtools::install_github('talgalili/heatmaply')

library(heatmaply)
x <- heatmapr(iris[,-5], scale = "column", colors = "Blues")
ggheatmap(x)

输出结果如下:

enter image description here

由于我正在使用GGally :: ggmatrix,似乎无法控制每个对象的比例。 在其他方面可能还有更多要做(例如处理标签的布局,在侧面添加颜色图例等)


ggheatmap is not in heatmaply any more, right? it was in version 0.8.3 but not in the current 0.11.1 - deeenes
嗨@deeenes,这是正确的。 ggheatmap函数已被删除,因为它还不够完善。然而,您可以使用“file”参数将heatmaply交互式输出保存为静态文件。我也添加了一个问题,也许将ggheatmap在未来重新添加回去... https://github.com/talgalili/heatmaply/issues/108 - Tal Galili

2

或者尝试使用heatmap3函数:

library(heatmap3)
Cars <- mtcars[c(1:7)]
heatmap3(cor(Cars), scale = "none", sym = T)

enter image description here


heatmap3很棒 - 但它不是基于ggplot2的。 - Tal Galili
是的,你说得完全正确。也许他不想重复造轮子。否则,你的方法似乎是一个解决方案。 - Roman
同意。 :) (我也更喜欢使用现有的解决方案) - Tal Galili

网页内容由stack overflow 提供, 点击上面的
可以查看英文原文,
原文链接