编辑:此问题不是重复的,我不想绘制数字而不是点,我想在我的点旁边绘制数字。
我正在使用matplotlib制作图形。 有三个要绘制的点[[3,9],[4,8],[5,4]]
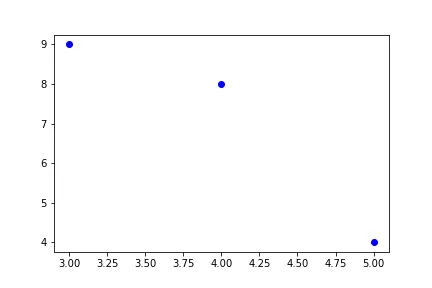
我可以轻松地用它们做一个散点图。
import matplotlib.pyplot as plt

allPoints = [[3,9],[4,8],[5,4]]

f, diagram = plt.subplots(1)

for i in range(3):
    xPoint =  allPoints[i][0]
    yPoint =  allPoints[i][1]
    diagram.plot(xPoint, yPoint, 'bo')
这将产生以下图表:
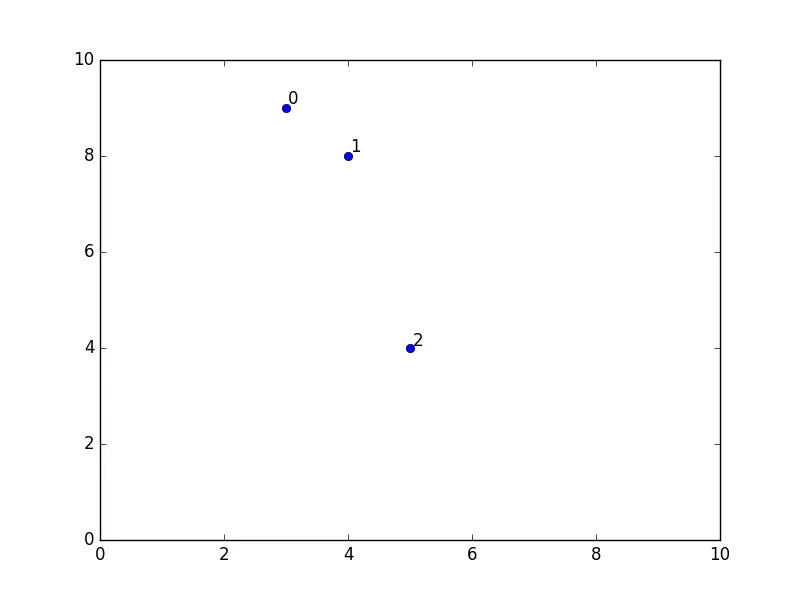
我想用数字1、2、3标记每个点。
根据这个SO答案,我尝试使用annotate来标记每个点。
import matplotlib.pyplot as plt

allPoints = [[1,3,9],[2,4,8],[3,5,4]]

f, diagram = plt.subplots(1)

for i in range(3):
    pointRefNumber = allPoints[i][0]
    xPoint =  allPoints[i][1]
    yPoint =  allPoints[i][2]
    diagram.annotate(pointRefNumber, (xPoint, yPoint))
这将产生一个空白的图。我紧密地遵循其他答案,但它没有产生任何图。我犯了哪个错误?