我正在使用R中附带的“diamonds”数据集。当尝试按照价格中位数对“color”因子进行排序时,无法正常工作。
这就是我的结果:
ggplot(diamonds, aes(x = reorder(color, -price, FUN=median), y = price)) +
  geom_boxplot() +
  facet_wrap(~cut) +
  ylim(0, 5500)
它给了我这个(完全没有排序):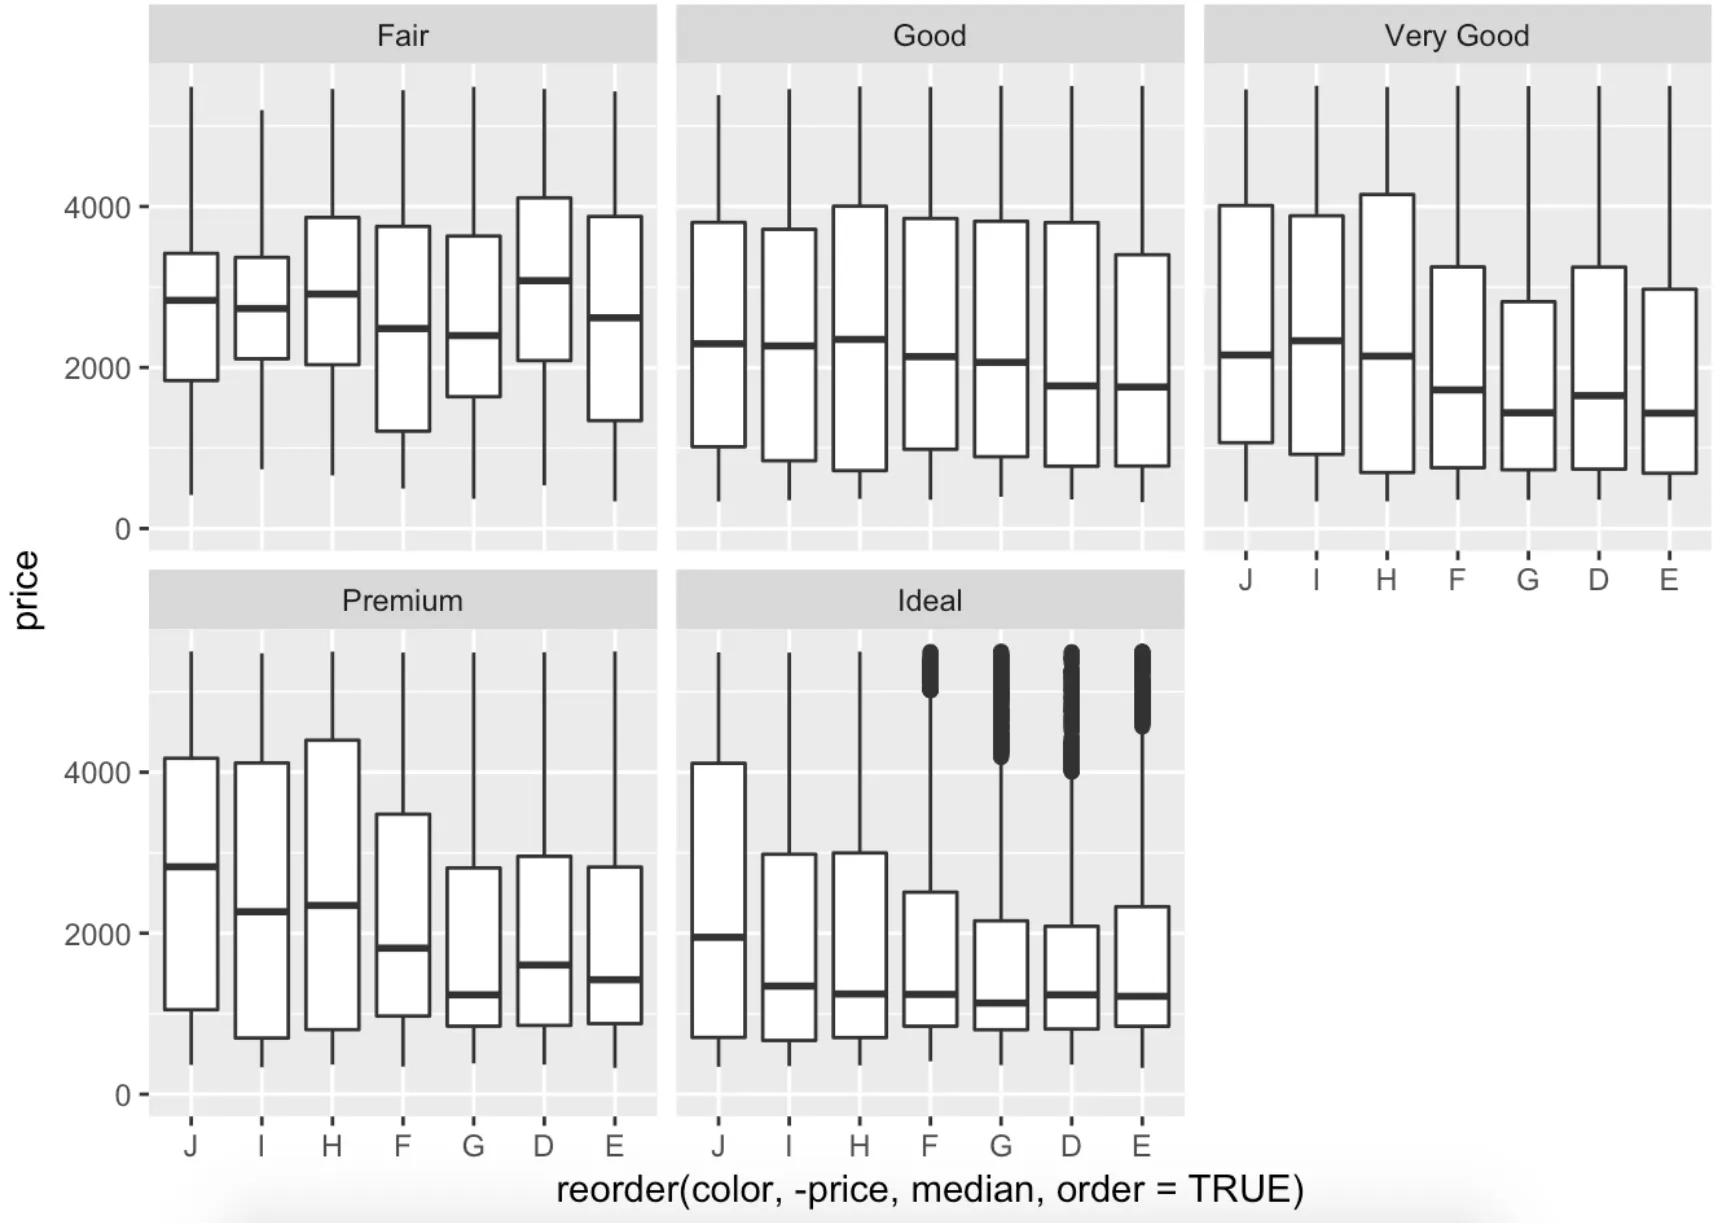
我是不是做错或遗漏了什么?
我正在使用R中附带的“diamonds”数据集。当尝试按照价格中位数对“color”因子进行排序时,无法正常工作。
这就是我的结果:
ggplot(diamonds, aes(x = reorder(color, -price, FUN=median), y = price)) +
geom_boxplot() +
facet_wrap(~cut) +
ylim(0, 5500)
它给了我这个(完全没有排序):
我是不是做错或遗漏了什么?
这里提供了一个相对简单的方法来实现所请求的排列,使用两个可用的辅助函数这里
reorder_within <- function(x, by, within, fun = mean, sep = "___", ...) {
  new_x <- paste(x, within, sep = sep)
  stats::reorder(new_x, by, FUN = fun)
}


scale_x_reordered <- function(..., sep = "___") {
  reg <- paste0(sep, ".+$")
  ggplot2::scale_x_discrete(labels = function(x) gsub(reg, "", x), ...)
}

library(tidyverse)
data(diamonds)

p <- ggplot(diamonds, aes(x = reorder_within(color, price, cut, median), y = price)) +
  geom_boxplot(width = 5) +
  scale_x_reordered()+
  facet_wrap(~cut,  scales = "free_x")
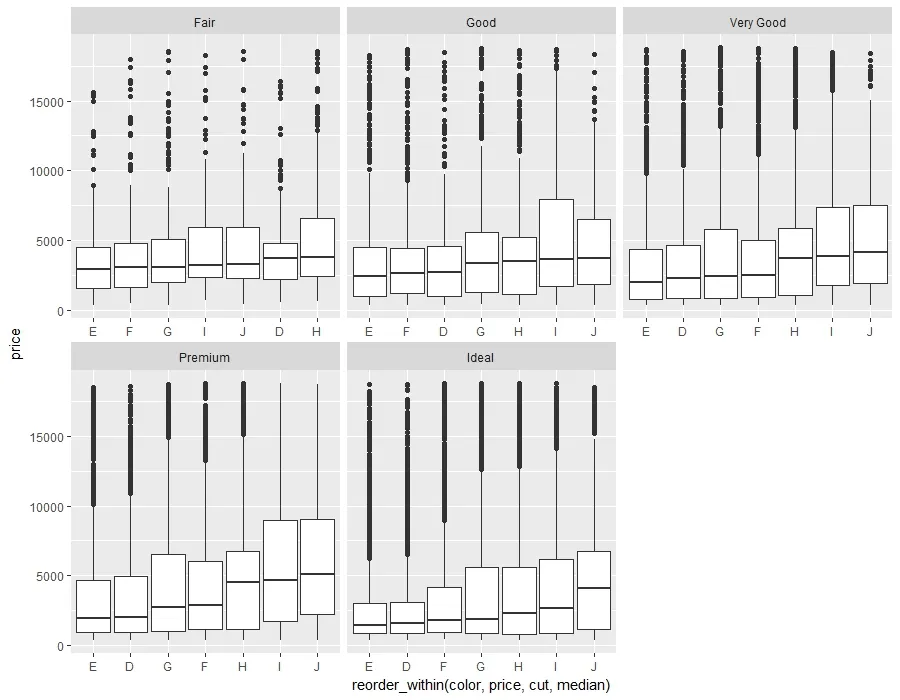
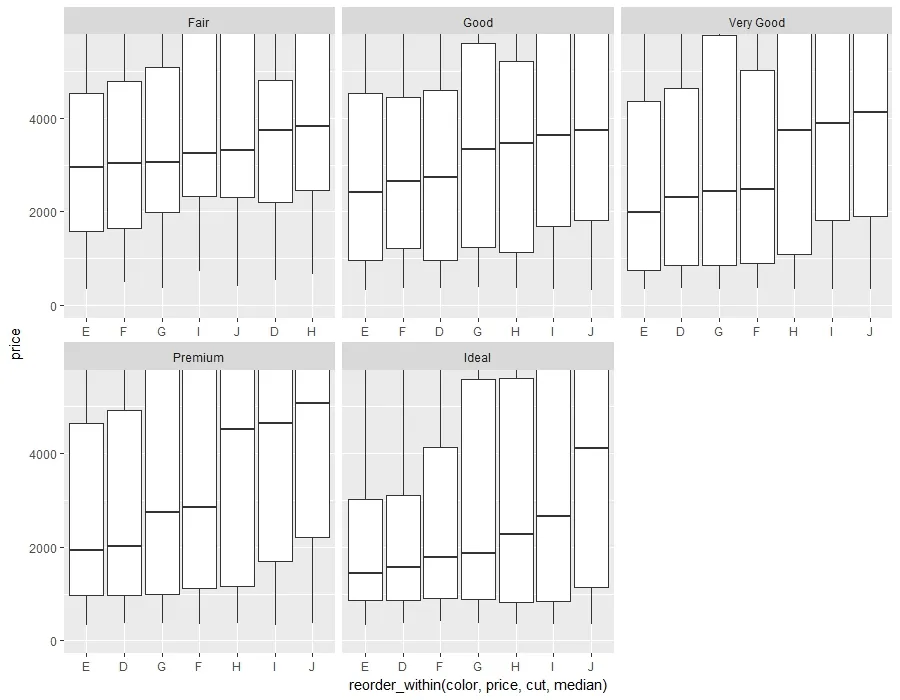
使用ylim(0, 5500)将删除大量数据,导致不同的箱线图干扰任何以前定义的顺序。如果您想限制某个轴而不这样做,最好使用:
p + coord_cartesian(ylim = c(0, 5500))
这将导致:
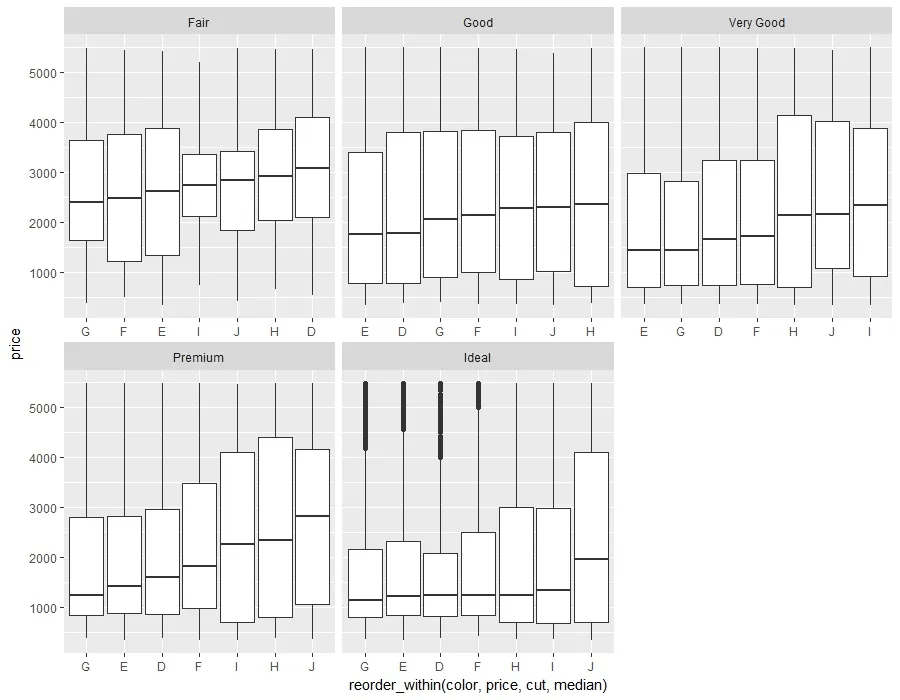
如果您确实打算删除大量数据并保持排列,则应在绘制图表之前对数据进行过滤:
diamonds %>%
  filter(price < 5500) %>%
  ggplot(aes(x = reorder_within(color, price, cut, median), y = price)) +
  geom_boxplot(width = 5) +
  scale_x_reordered()+
  facet_wrap(~cut,  scales = "free_x")
FUN = function(x) fun(x, na.rm=T) :) - Matias Andinaggplot(diamonds, aes(x = reorder(color, -price, FUN=median), y = price)) +
geom_boxplot() +
facet_wrap(~cut) +
ylim(0, 5500)
levels(diamonds$color) # "D" "E" "F" "G" "H" "I" "J"
diamonds$color <- reorder(diamonds$color, -diamonds$price, FUN=median)
levels(diamonds$color) # "J" "I" "H" "F" "G" "D" "E"
ggplot(diamonds, aes(x =color, y = price))+
geom_boxplot() +
facet_wrap(~cut) +
ylim(0, 5500)
实际上你所拥有的是以下顺序
  ggplot(diamonds, aes(x =color, y = price))+
      geom_boxplot() +
      ylim(0, 5500)
但是来自missuse的答案非常好。