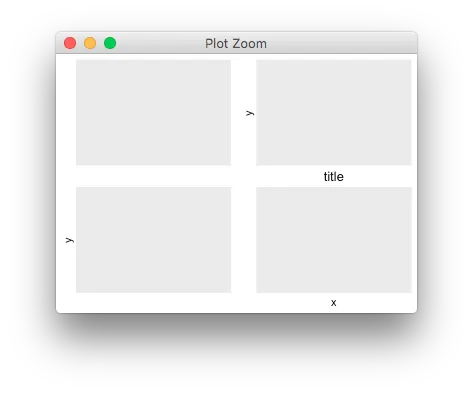
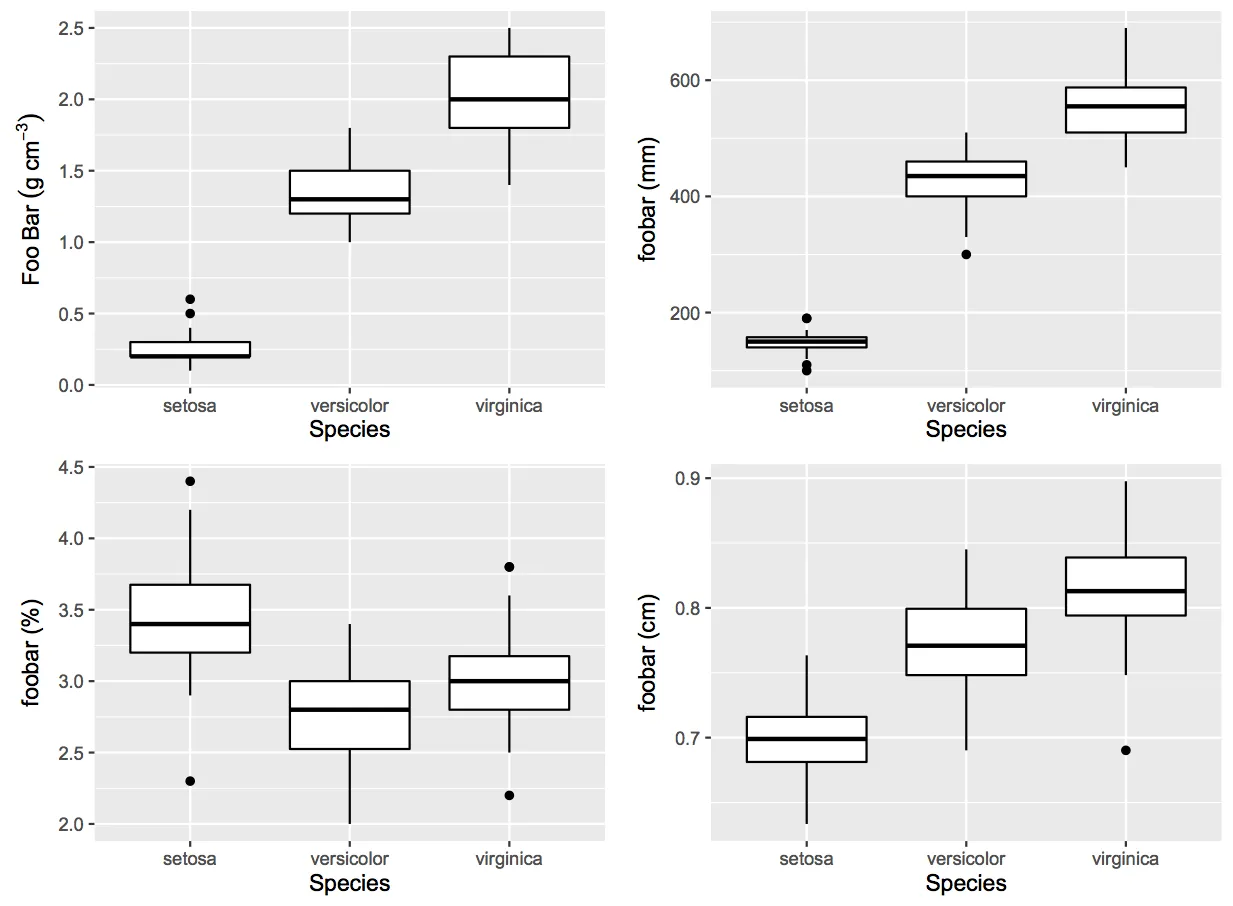
我试图使用grobs和gtable将四个(ggplot2)图形排列成2x2的网格。我不知道如何设置宽度,以及非1xn或nx1的排列方法。
使用以下代码:
data(iris)
a <- ggplot(iris, aes(x=Species, y=Petal.Width)) + geom_boxplot(color="black") + ylab(expression(Foo~Bar~(g~cm^{-3})))
b <- ggplot(iris, aes(x=Species, y=Petal.Length*100)) + geom_boxplot(color="black") + ylab("foobar (mm)")
c <- ggplot(iris, aes(x=Species, y=Sepal.Width)) + geom_boxplot(color="black") + ylab("foobar (%)")
d <- ggplot(iris, aes(x=Species, y=log10(Sepal.Length))) + geom_boxplot(color="black") + ylab("foobar (cm)")

plots <- list(a,b,c,d)
grobs = lapply(plots, ggplotGrob)
g = do.call(rbind, c(grobs, size="first"))

g$widths = do.call(unit.pmax, lapply(grobs, "[[", "widths"))
grid.newpage()
grid.draw(g)
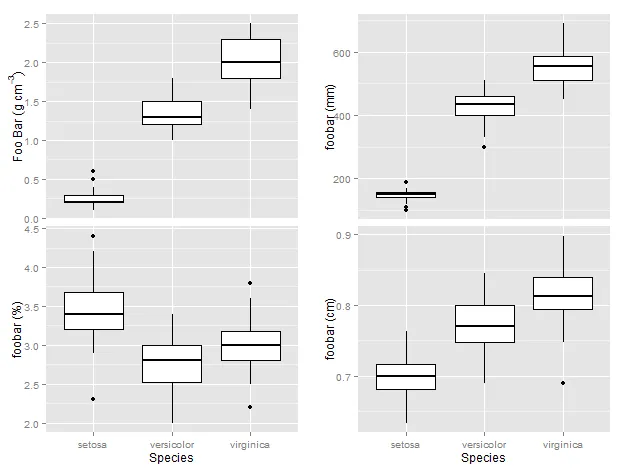
我可以创建以下1x4的排列方式。
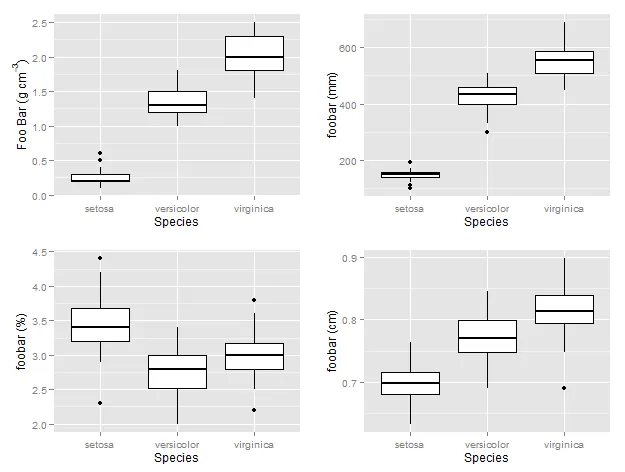
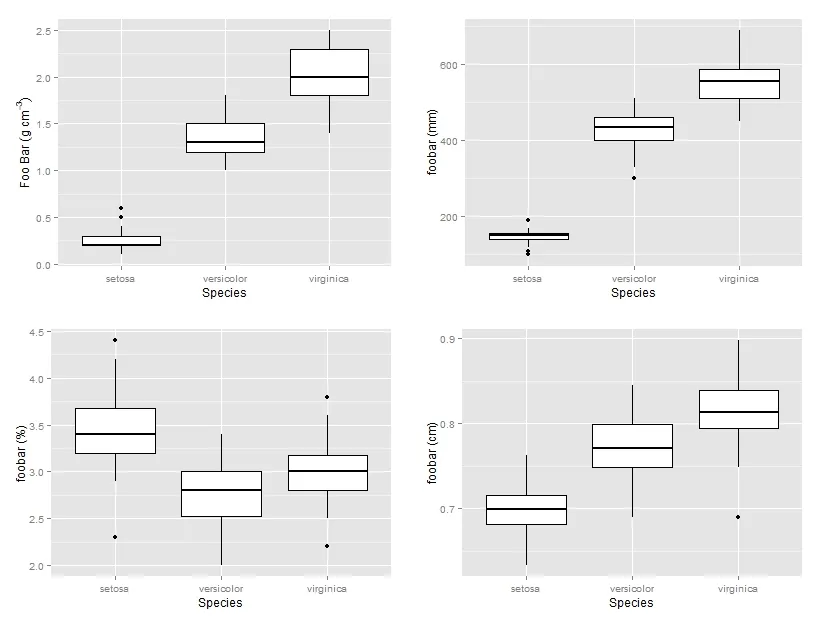
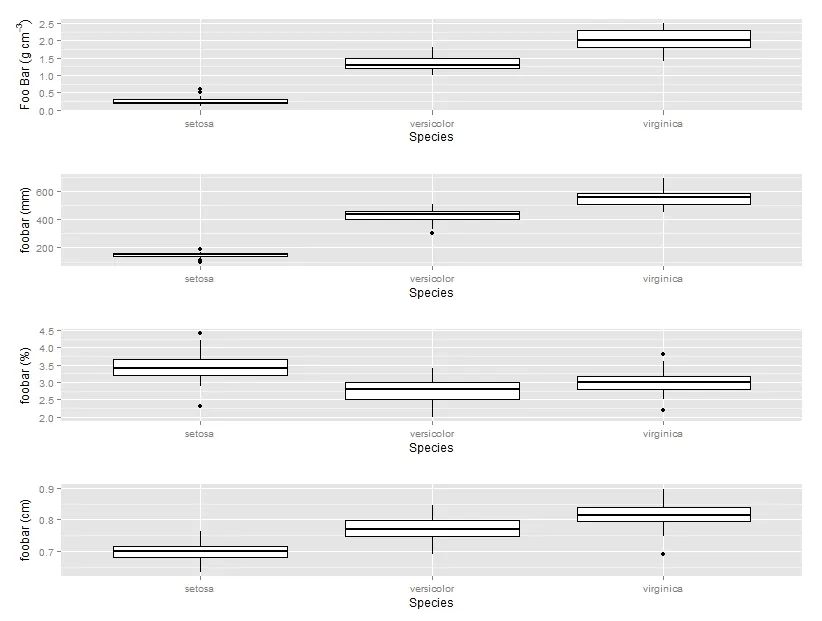 如果我使用grid.arrange来做两栏,对于这4张图来说,它们的宽度是不同的。
如何将图绑定到gtable中以获得4x4的排列?
# I thought maybe I could cbind, then rbind, but this does not work
plots1 <- list(a,b)
plots2 <- list(c,d)
grobs1 = lapply(plots1, ggplotGrob)
grobs2 = lapply(plots2, ggplotGrob)

g1 = do.call(cbind, c(grobs1, size="first"))
g2 = do.call(cbind, c(grobs2, size="first"))
# g3 = do.call(rbind, c(g1,g2, size="first")) #this does not work