如何在ggplot plot图表中包含多个grobs对象,而不是每次都使用annotation_custom?
这是我的代码:
df <- data.frame(x = 1:10, y = 1:10)
df2 <- data.frame(x = 1 , y = 1)
g <- ggplotGrob(ggplot(df2, aes(x, y)) +
geom_point() +
theme(plot.background = element_rect(colour = "black")))
base <- ggplot(df, aes(x, y)) +
geom_blank() +
theme_bw()
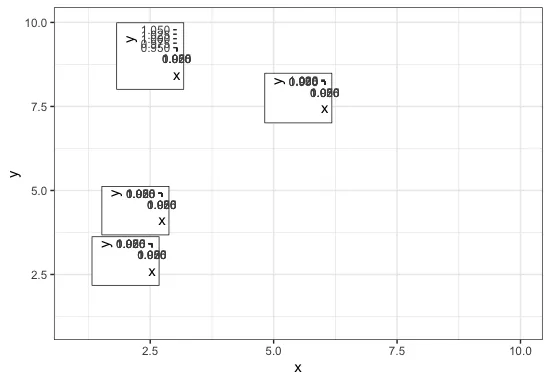
base +
annotation_custom(grob = g, xmin = 3, xmax = 2, ymin = 8, ymax = 10)+
annotation_custom(grob = g, xmin = 1.5, xmax = 2.5, ymin = 2.8, ymax = 3)+
annotation_custom(grob = g, xmin = 1.7, xmax = 2.7, ymin = 3.8, ymax = 5)+
annotation_custom(grob = g, xmin = 5, xmax = 6, ymin = 7, ymax = 8.5)
我的实际问题比这个例子更严重。
有没有一种方法可以把所有这些“grobs”例如放在一个列表中,并只选择我想要定位它们的坐标。还是我需要一直使用annotation_custom?
求助。

dput(df)为我们提供df吗? - neuron