R图形具有网格包,理论上允许使用grid.curve在形状之间创建曲线箭头(请参见此处的grid.curve描述https://www.stat.auckland.ac.nz/~paul/grid/curve/curve.pdf)。但是,似乎grid.curve无法连接跨视图的grobs。
我想将以下代码更改为使用曲线箭头连接两个圆圈,就像grid.curve函数示例一样。 有人知道如何做到这一点吗?
以下是示例代码
library(grid)
library(gridExtra)
# Layout Branches
pdf("test.pdf")
grid.newpage()
layout=grid.layout(nrow=2,ncol=2)
pushViewport(viewport(layout=layout,name="base"))
#Now add circles for states
seekViewport("base")
for (ii in 1:2) {
for(jj in 1:2) {
name=paste(ii,jj,sep="a")
name2=paste(ii,jj,sep="_")
pushViewport(viewport(layout.pos.col=jj, layout.pos.row=ii, name = name2))
grid.circle(r=.4, name = name)
upViewport()
}}
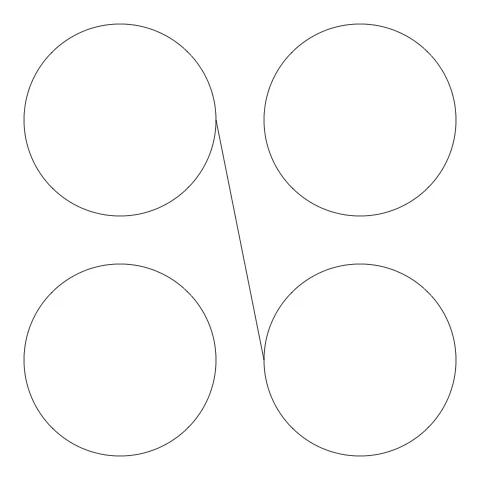
seekViewport("1_1")
grid.move.to(grobX("1a1",0),grobY("1a1",0))
seekViewport("2_2")
grid.line.to(grobX("2a2",180),grobY("2a2",180))
dev.off()
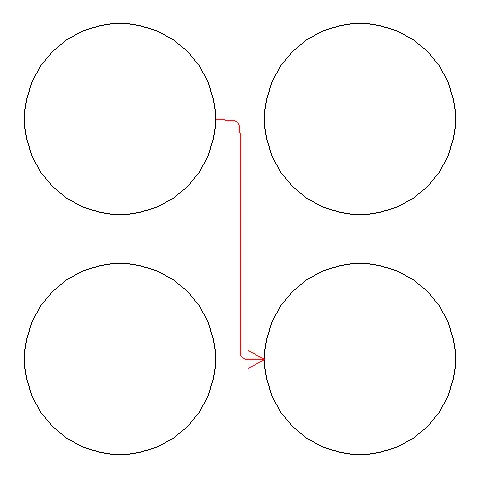
diagram包(例如参见 the vignette)。 - Henrikcurrent.transform(),这似乎是在不同视口坐标系之间进行转换的唯一(或至少是最简单的)方法。值得一提的是,这也是 grid 在 grid.locator() 中内部使用的方法;另外,可以参考 Paul Murrell 在 这个 R-help 线程 中的贡献,以进一步证明没有更好的方法。 - Josh O'Brien