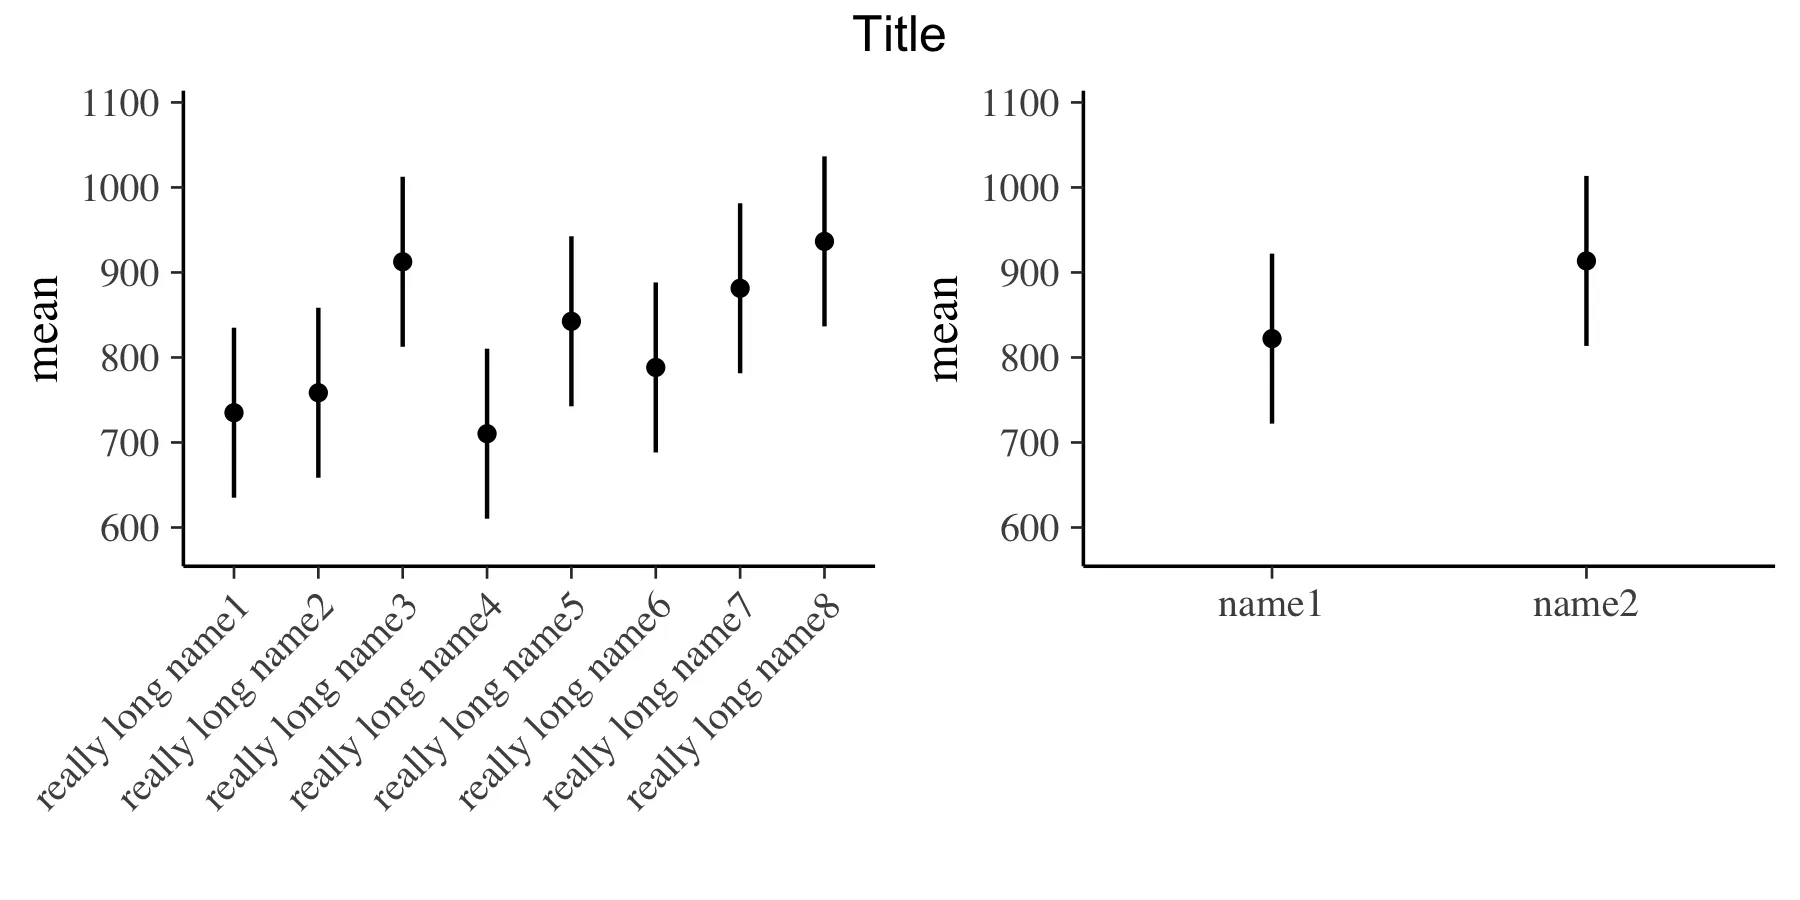
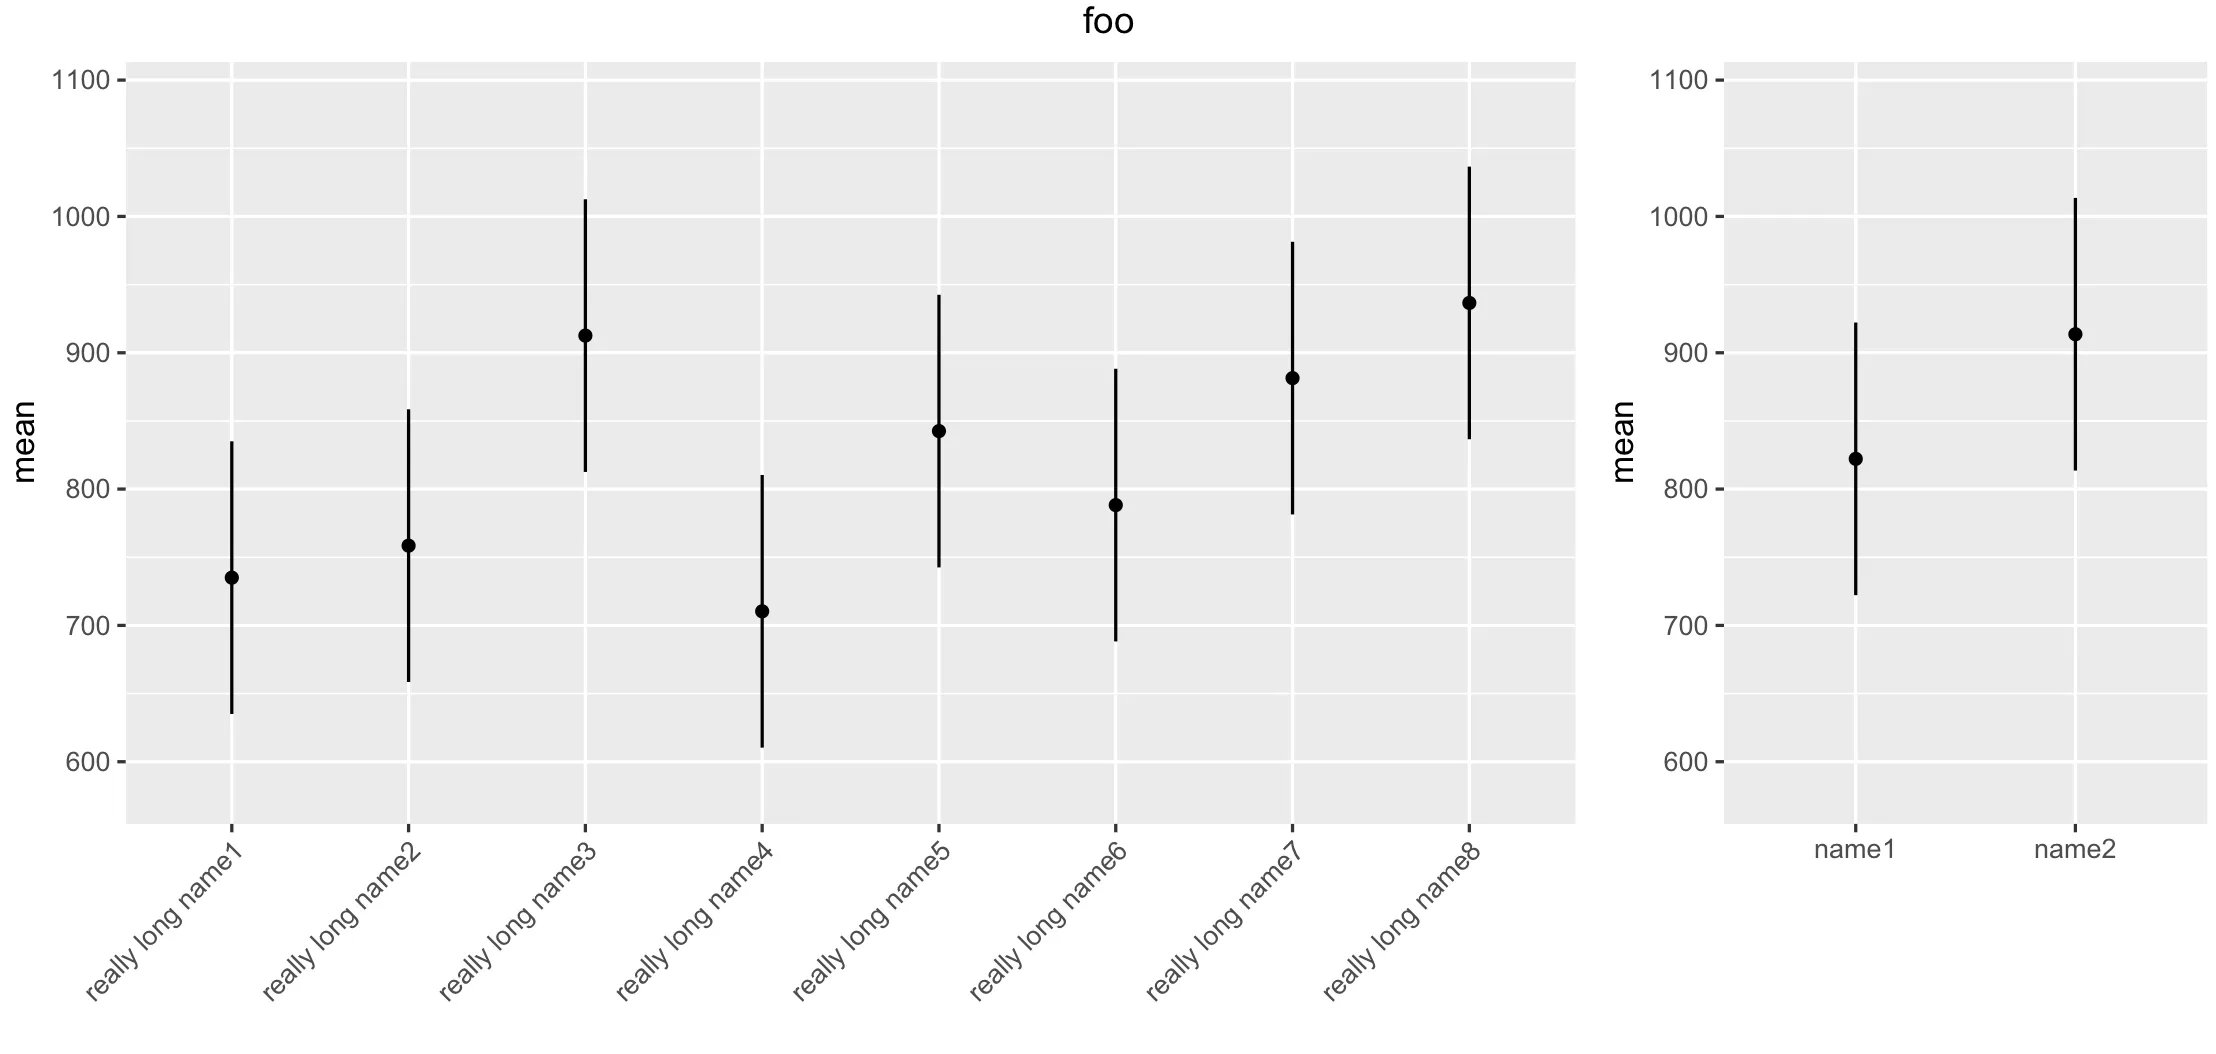
我使用
ggplot2创建了两个图,并希望同时使用gtable显示它们。我有两个问题。第一个问题是,我想要两个图的面板大小相匹配。我已经使用gtable完成了这个任务。第二个问题是,我想让第一张图的宽度是第二张图的三倍。但我无法在使用bind()函数时实现这一点并保持面板大小相同。以下是可重现的代码。library(ggplot2)
library(gtable)
set.seed(2345)
mean1 <- runif(8, 700, 1000)
low1 <- mean1 - 100
high1 <- mean1 + 100
names1 <- paste0("really long name", 1:length(mean1))
df1 <- data.frame(mean = mean1,
low = low1,
high = high1,
names = names1)
mean2 <- runif(2, 700, 1000)
low2 <- mean2 - 100
high2 <- mean2 + 100
names2 <- paste0("name", 1:length(mean2))
df2 <- data.frame(mean = mean2,
low = low2,
high = high2,
names = names2)
plot1 <- ggplot(df1, aes(x = names, y = mean)) +
geom_errorbar(aes(ymin = low, ymax = high), width = 0) +
geom_point() +
scale_y_continuous(limits = c(.95*min(df1$low), 1.05*max(df1$high))) +
xlab("") +
theme(axis.text.x = element_text(angle = 45, hjust = 1))
plot2 <- ggplot(df2, aes(x = names, y = mean)) +
geom_errorbar(aes(ymin = low, ymax = high), width = 0) +
geom_point() +
scale_y_continuous(limits = c(.95*min(df1$low), 1.05*max(df1$high))) +
xlab("") +
theme(axis.text.x = element_text(angle = 0, hjust = .5))
grob1 <- ggplotGrob(plot1) #Convert to gtable
grob2 <- ggplotGrob(plot2) #Convert to gtable
grob <- cbind(grob1, grob2, size = "first") #Bind rt data
title <- textGrob("Title", gp = gpar(fontsize = 12)) #Add title
grob <- gtable_add_rows(
grob, #gtable object
heights = grobHeight(title) + padding, #height for new row
pos = 0 #0 adds on top
)
grob <- gtable_add_grob(
grob, #gtable object
title, #grob to be added
t = 1, l = 1, r = ncol(sG) #top, left, and right (18) extent of grob
)
grid.newpage()
grid.draw(grob)