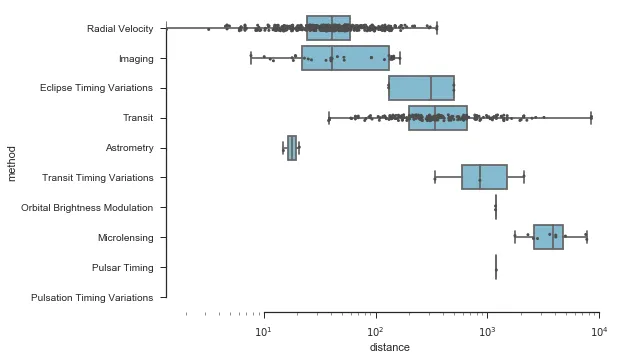
以下是一个seaborn的箱线图例子,来自于https://stanford.edu/~mwaskom/software/seaborn/examples/horizontal_boxplot.html
import numpy as np
import seaborn as sns
sns.set(style="ticks", palette="muted", color_codes=True)

# Load the example planets dataset
planets = sns.load_dataset("planets")

# Plot the orbital period with horizontal boxes
ax = sns.boxplot(x="distance", y="method", data=planets,
                 whis=np.inf, color="c")

# Add in points to show each observation
sns.stripplot(x="distance", y="method", data=planets,
              jitter=True, size=3, color=".3", linewidth=0)


# Make the quantitative axis logarithmic
ax.set_xscale("log")
sns.despine(trim=True)
能否将这些条目按从大到小(或相反)的顺序进行“排名”?在这个图中,如果按从大到小排序,“astrometry”应该是最后一个条目。
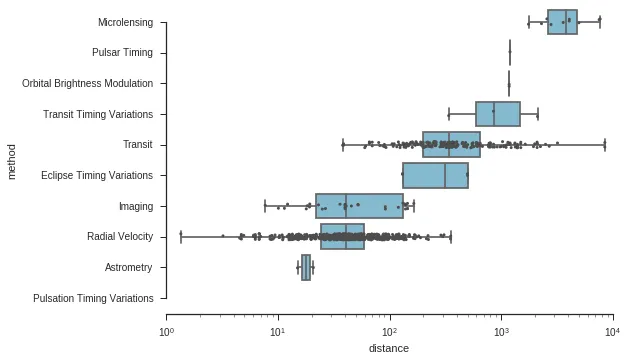
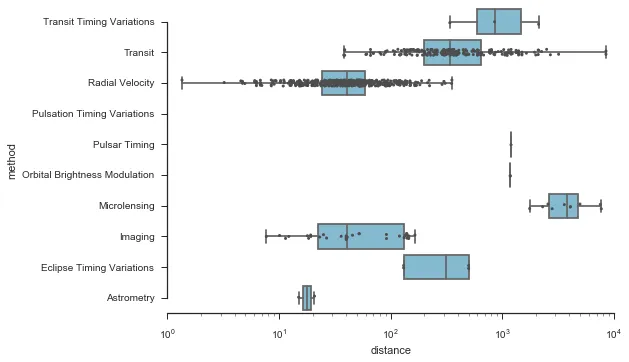
order参数运行得很好。我不确定另一个评论去哪了... - ShanZhengYang