为自定义显示在小提琴图内的箱形图样式,可以尝试在小提琴图前绘制一个箱形图。但是,当使用seaborn时,这似乎不起作用,因为它总是显示在小提琴图的后面。
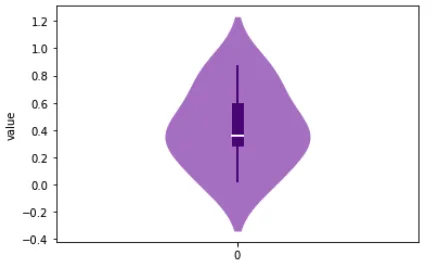
当使用seaborn + matplotlib时,这可以工作(但仅适用于单个类别):
import matplotlib.pyplot as plt
import seaborn as sns
import numpy as np

df=pd.DataFrame(np.random.rand(10,2)).melt(var_name='group')

fig, axes = plt.subplots()

# Seaborn violin plot
sns.violinplot(y=df[df['group']==0]['value'], color="#af52f4", inner=None, linewidth=0, saturation=0.5)

# Normal boxplot has full range, same in Seaborn boxplot
axes.boxplot(df[df['group']==0]['value'], whis='range', positions=np.array([0]),
            showcaps=False,widths=0.06, patch_artist=True,
            boxprops=dict(color="indigo", facecolor="indigo"),
            whiskerprops=dict(color="indigo", linewidth=2),
            medianprops=dict(color="w", linewidth=2 ))

axes.set_xlim(-1,1)

plt.show()
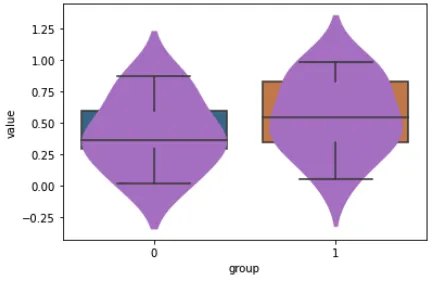
但是,当只使用seaborn跨多个类别绘制图表时,排序总是错误的:
sns.violinplot(data=df, x='group', y='value', color="#af52f4", inner=None, linewidth=0, saturation=0.5)
sns.boxplot(data=df, x='group', y='value', saturation=0.5)


plt.show()
即使尝试使用zorder修复,这也不起作用。

boxprops={"zorder": 2}传递给boxplot函数,这样您就不需要与艺术家列表打交道了。 - mwaskom