Seaborn条形图与小提琴图,点的前面有条形图柱。

3

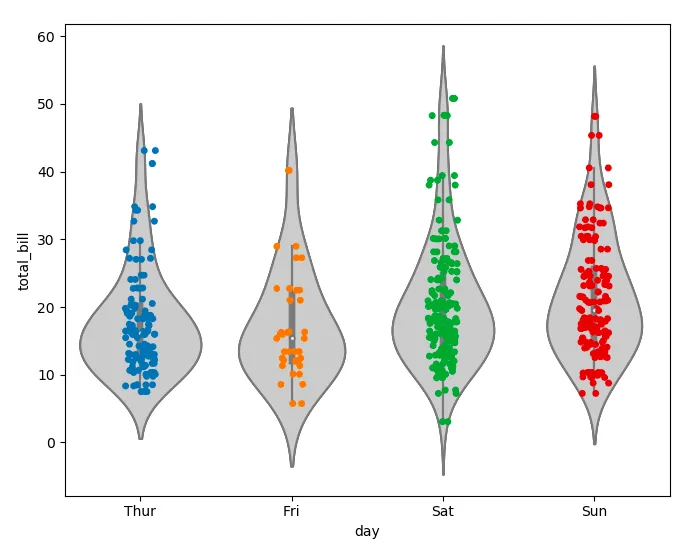
我想在抖动条带图后面绘制一个小提琴图。结果图中的均值/标准差条纹在抖动点的后面,使其难以观察。我想知道是否有一种方法可以让条纹显示在点的前面。

import seaborn as sns
import matplotlib.pyplot as plt

tips = sns.load_dataset("tips")

sns.violinplot(x="day", y="total_bill", data=tips, color="0.8")
sns.stripplot(x="day", y="total_bill", data=tips, jitter=True)
plt.show()

violin


如何使用swarmplot? - warped
是的,可能会起作用,但我仍然希望能够在点上绘制平均/标准差标记。 - Carlos G. Oliver
1
除非您提供最小、完整和可验证的示例,否则没有人能够提供具体的工作解决方案。 - Sheldore
2个回答

4
Seaborn不关心向用户公开创建的对象。因此,需要从轴中收集它们以进行操作。在这里要更改的属性是zorder。因此,想法可以是:

  1. 绘制小提琴图
  2. 从轴中收集线条和点,并给线条一个较高的zorder,给点一个更高的zorder
  3. 最后绘制条形图或蜂群图。这将自动具有较低的zorder

例子:

import seaborn as sns
import matplotlib.pyplot as plt
from matplotlib.collections import PathCollection

tips = sns.load_dataset("tips")

ax = sns.violinplot(x="day", y="total_bill", data=tips, color=".8")

for artist in ax.lines:
    artist.set_zorder(10)
for artist in ax.findobj(PathCollection):
    artist.set_zorder(11)

sns.stripplot(x="day", y="total_bill", data=tips, jitter=True, ax=ax)

plt.show()

enter image description here


3

我刚遇到了同样的问题,只需调整sns.stripplot中的zorder参数即可轻松解决:

import seaborn as sns
import matplotlib.pyplot as plt

tips = sns.load_dataset("tips")

sns.violinplot(x="day", y="total_bill", data=tips, color="0.8")
sns.stripplot(x="day", y="total_bill", data=tips, jitter=True, zorder=1)
plt.show()

结果类似于@ImportanceOfBeingErnest的答案所示: enter image description here

网页内容由stack overflow 提供, 点击上面的
可以查看英文原文,
原文链接