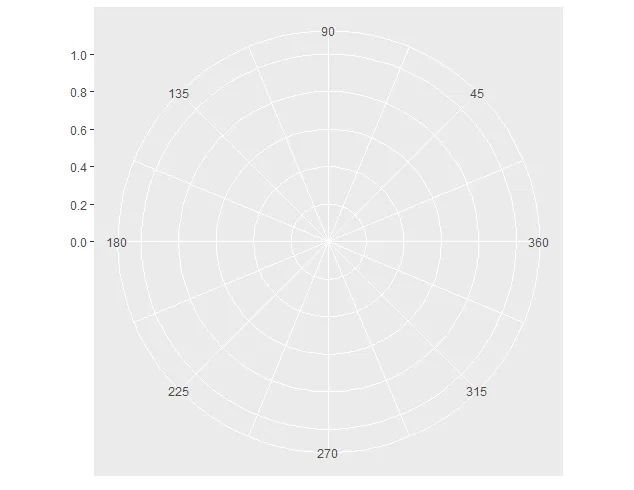
我有一个圆形空间,其中角度0和360等效。我想在这个空间中绘制矩形,使得矩形可以跨越这个值。然而,我在使用ggplot2时遇到了麻烦。
base <- ggplot() +
  scale_x_continuous(breaks = seq(45, 360, 45), limits = c(0, 360)) +
  scale_y_continuous(breaks = seq(0, 1, 0.2), limits = c(0, 1)) +
  coord_polar(theta = "x", start = 1.5 * pi, direction = -1)
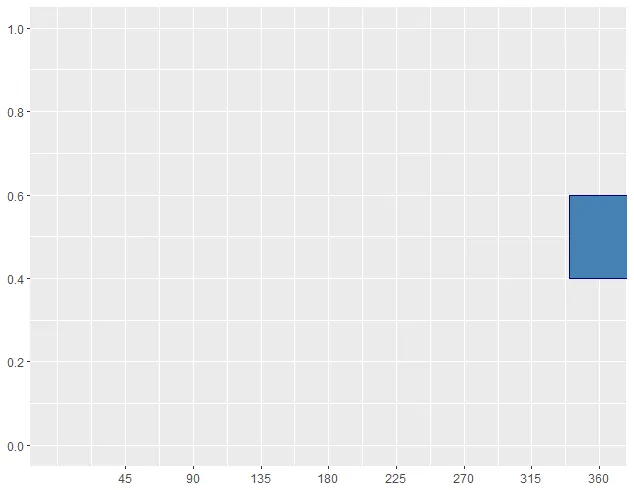
1. 尝试使用超出xlim限制的值进行绘图:
base + geom_rect(aes(xmin = 340, xmax = 380, ymin = 0.4, ymax = 0.6),
  color = "darkblue", fill = "steelblue")
#> Warning message:
#> Removed 1 rows containing missing values (geom_rect).
所有在xlim之外的值都将被删除,因此这种方法行不通。
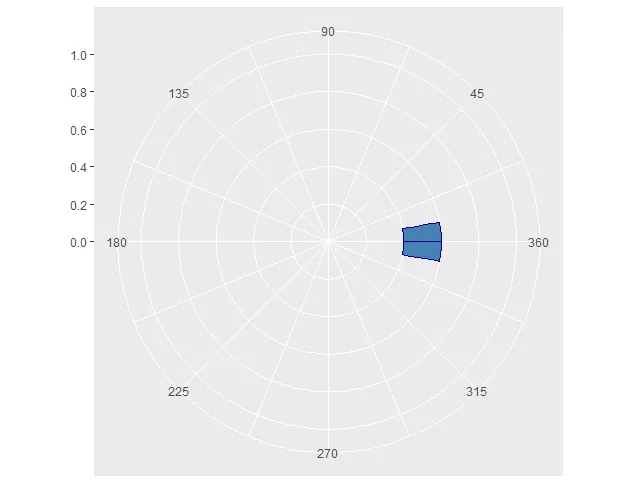
2. 尝试使用重新缩放的数据进行绘图
base + geom_rect(aes(xmin = 340, xmax = 380 %% 360, ymin = 0.4, ymax = 0.6),
  color = "darkblue", fill = "steelblue")
 这样至少能产生一张图,但是它绘制的方向与我的意愿相反。它不是从340度到380度逆时针旋转,而是从340度到20度顺时针旋转。
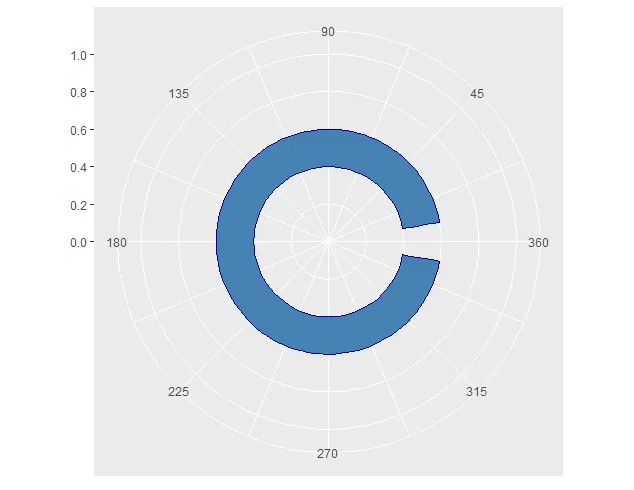
3. 尝试作为两个相接元素绘制
  base + geom_rect(aes(xmin = c(350, 0), xmax = c(360, 10), ymin = 0.4, ymax = 0.6),
    color = "darkblue", fill = "steelblue")
这显示了我想要它的矩形,但这不是一个令人满意的解决方案,因为在0/360度角处有笔画线,并且现在我必须将每个矩形表示为两个矩形。
4. 尝试1:使用缩放而非剪切
ggplot() +
  scale_x_continuous(breaks = seq(45, 360, 45)) +
  scale_y_continuous(breaks = seq(0, 1, 0.2), limits = c(0, 1)) +
  coord_cartesian(xlim = c(0, 360)) +
  coord_polar(theta = "x", start = 1.5 * pi, direction = -1) +
  geom_rect(aes(xmin = 340, xmax = 380, ymin = 0.4, ymax = 0.6),
    color = "darkblue", fill = "steelblue")
 这似乎失去了缩放和限制。
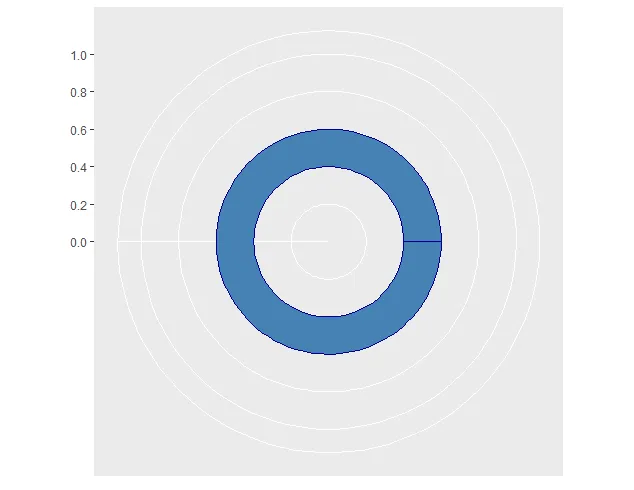
5. 尝试使用缩放而不是剪裁的第二次尝试
ggplot() +
  scale_x_continuous(breaks = seq(45, 360, 45)) +
  scale_y_continuous(breaks = seq(0, 1, 0.2), limits = c(0, 1)) +
  coord_polar(theta = "x", start = 1.5 * pi, direction = -1) +
  coord_cartesian(xlim = c(0, 360)) +
  geom_rect(aes(xmin = 340, xmax = 380, ymin = 0.4, ymax = 0.6),
    color = "darkblue", fill = "steelblue")
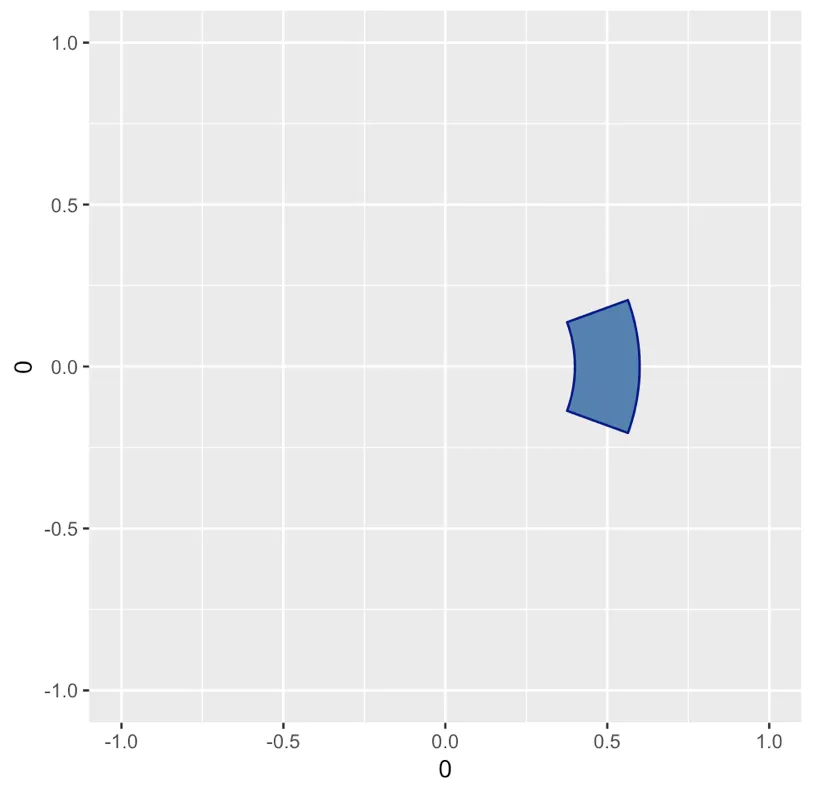
 这样可以正确缩放,但会覆盖极坐标系。
如果有人能够提供此问题的解决方案或想法,我将不胜感激。再次说明,我正在寻找类似于#3的东西,但没有内部描边,并且不需要使用两个矩形。
编辑:这个问题是相关的,但也没有得到答案。
color =“darkblue”,并仅使用fill =来消除0/360处的描边线。这并不能解决绘制两个矩形的需求,但不幸的是,ggplot中的一些东西仍然需要解决方法。 - Jan Boyer