我绘制了以下内容:
library(ggplot2)

carrots <- data.frame(length = rnorm(500000, 10000, 10000))
cukes <- data.frame(length = rnorm(50000, 10000, 20000))
carrots$veg <- 'carrot'
cukes$veg <- 'cuke'
vegLengths <- rbind(carrots, cukes)

ggplot(vegLengths, aes(length, fill = veg)) +
 geom_density(alpha = 0.2)
现在假设我只想绘制x=-5000到5000之间的区域,而不是整个范围。
我该怎么做?
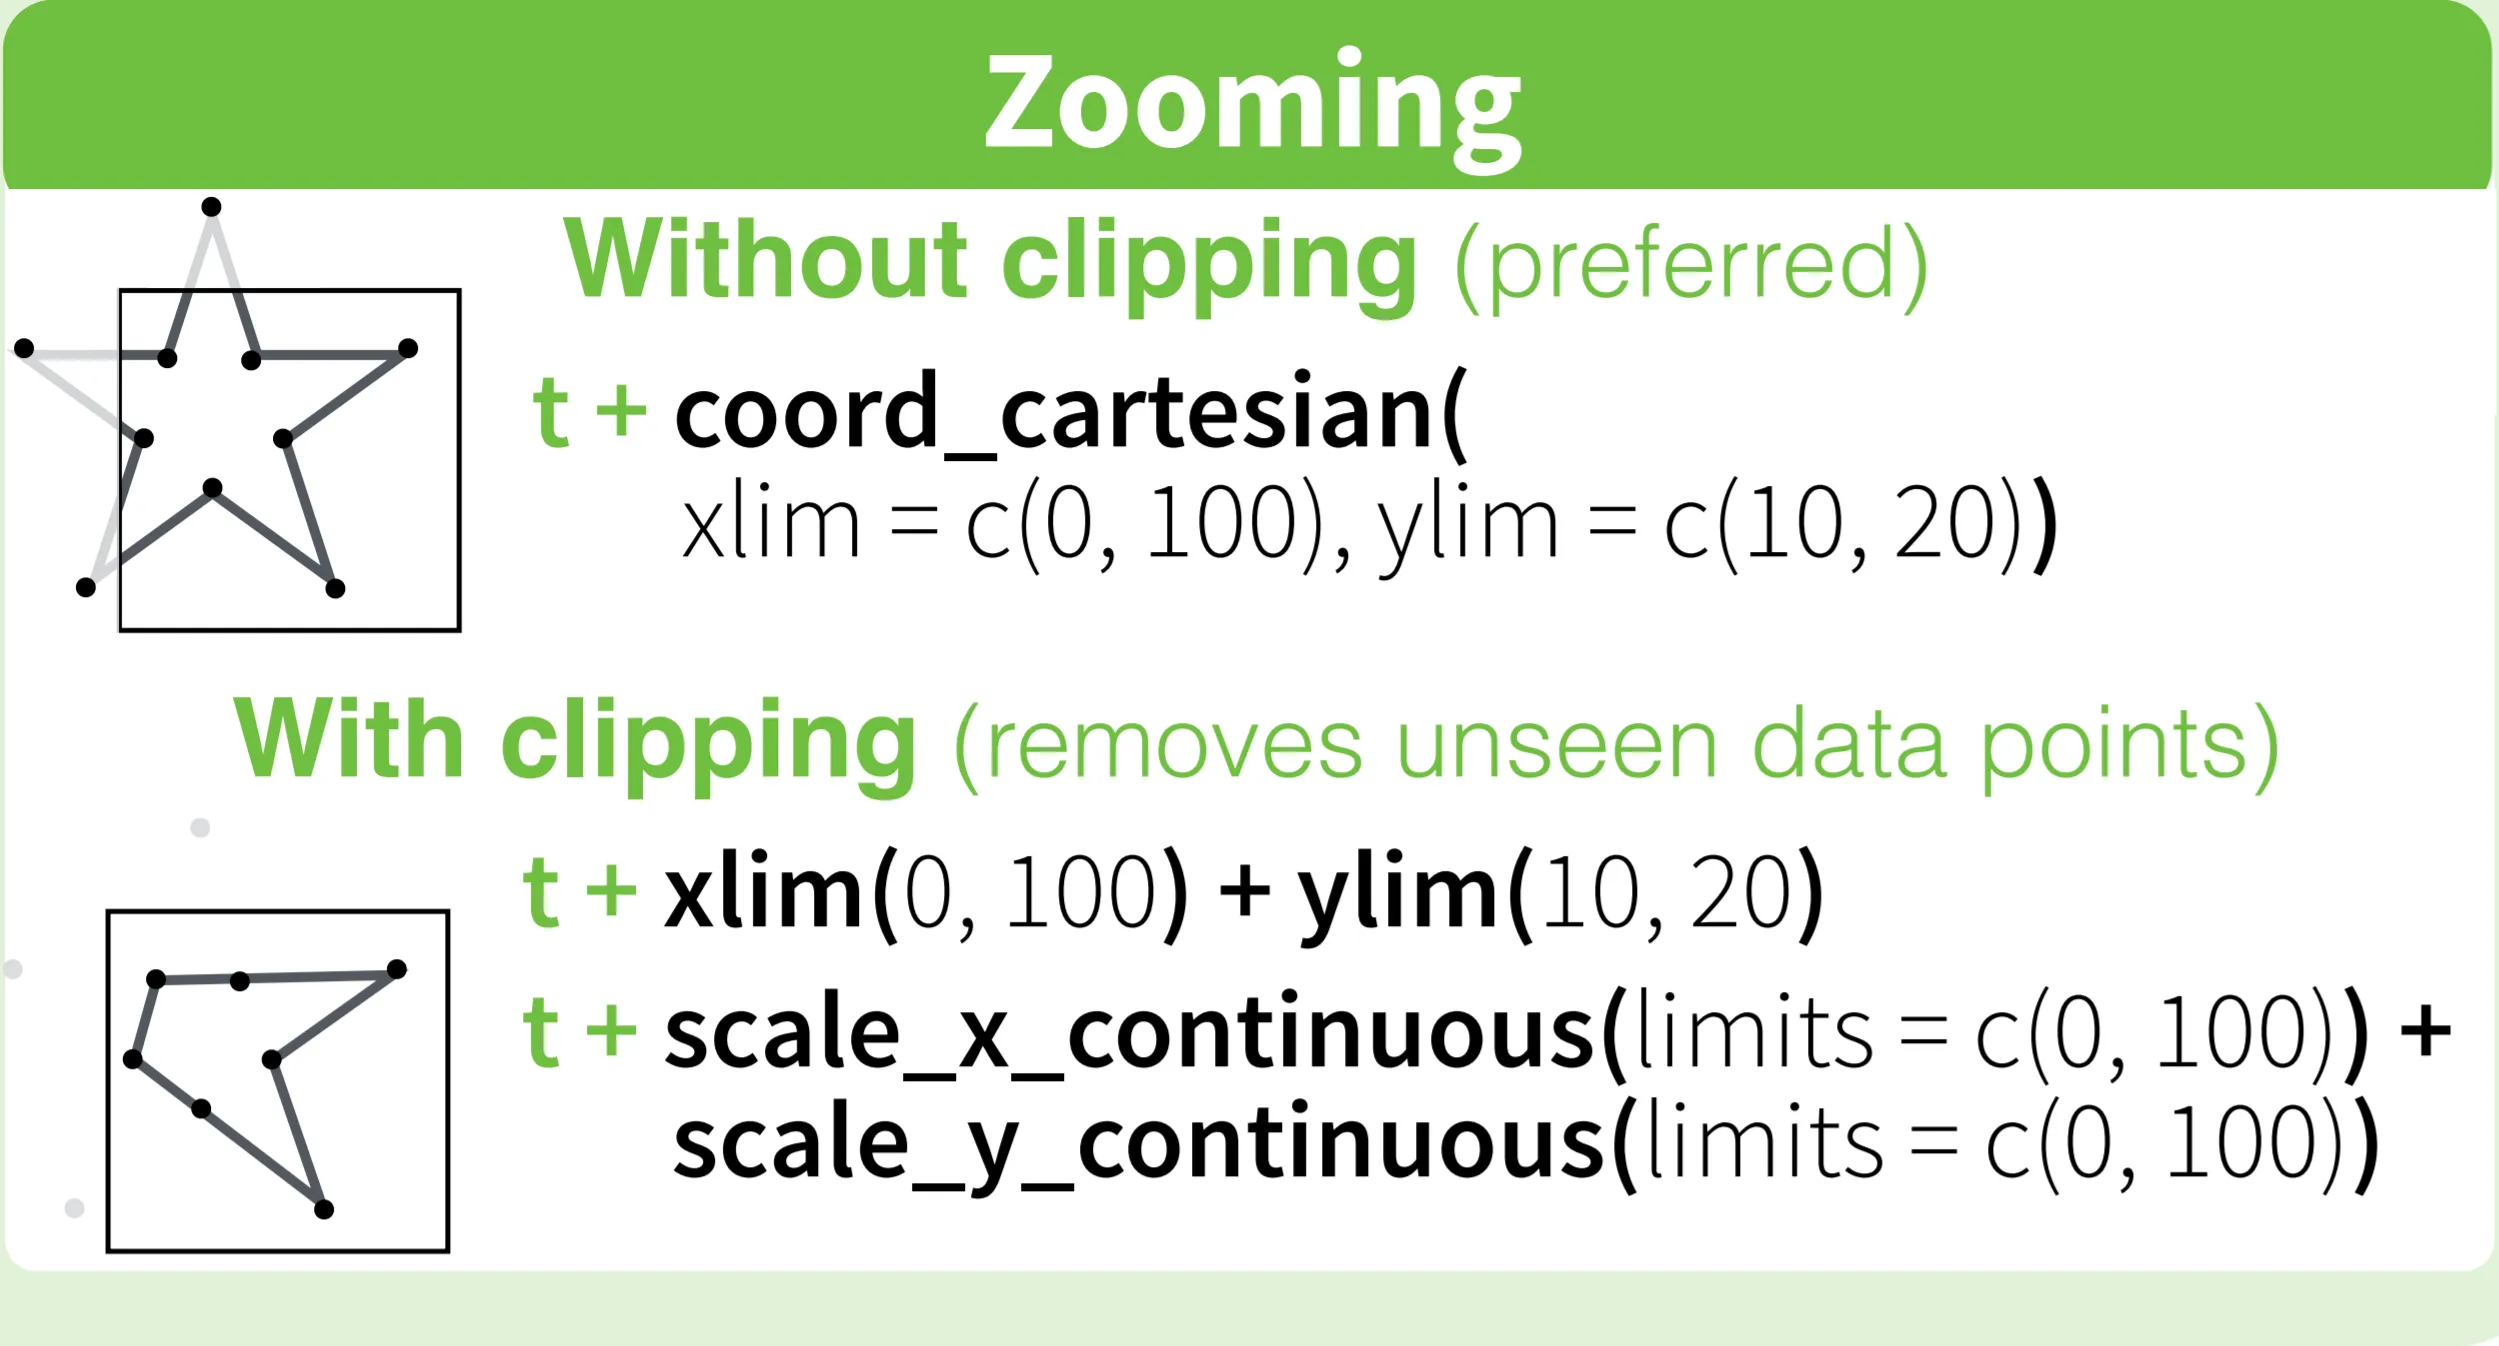
library(scales)),可以使用scale_x_continuous函数来设置x轴的范围限制为-5000到5000,同时也可以使用参数oob=squish来避免超出范围的数据在图表中出现(默认情况下是oob=censor)。如果需要了解更多关于squish和censor的信息,请查看?squish和?censor。原文链接:https://groups.google.com/forum/#!topic/ggplot2/AsJ6xpmR9tU - Ben Bolkercoord_cartesian方法也是这样吗? - Nick Staunercoord_cartesian(xlim =时,您可能还需要重置ylim,并重置标签和网格间隔。 - PatrickT