r - ggplot2:使用直线连接极坐标中的点

6

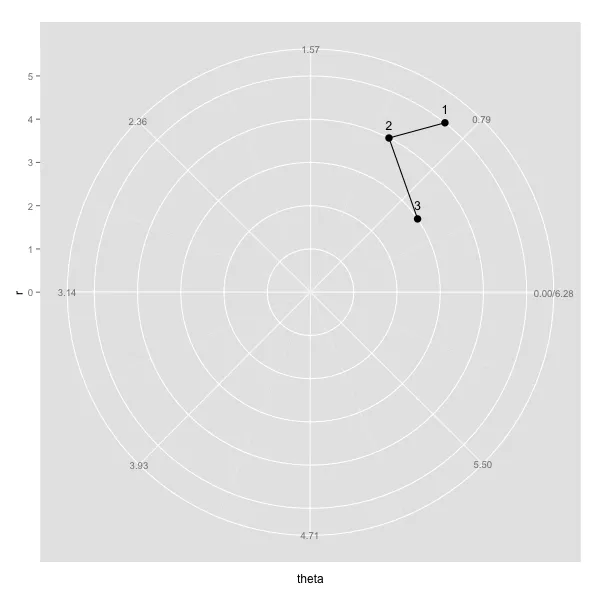
我有一个极坐标图的数据。我使用geom_path连接这些点,但我希望路径是直线。以下是我的代码:

example <- data.frame(c(5,4,3),c(0.9,1.1,0.6))

colnames(example) <- c("r", "theta")

myplot <- ggplot(example, aes(r, theta)) + geom_point(size=3.5) +
  coord_polar(theta="y", start = 3/2*pi, direction=-1) + 
  scale_x_continuous(breaks=seq(0,max(example$r)), lim=c(0, max(example$r))) + 
  scale_y_continuous(breaks=round(seq(0, 2*pi, by=pi/4),2), expand=c(0,0), lim=c(0,2*pi)) +
  geom_text(aes(label=rownames(example)), size=4.4, hjust=0.5, vjust=-1) + 
  geom_path()

我很感激任何建议。


这个链接可能会给你一些启示。在尝试了一些类似于你的问题的初始尝试(“(3)使用ggplot2创建径向图”)之后,他们最终使用“(5)使用CreateRadialPlot函数创建径向图”。 - Henrik
这个 Q&A 展示了曲线的相同问题。fmsb 包中的 radarchart 被提及。 - Henrik
谢谢你的建议,Henrik。我会查看你推荐的页面。 - Maria Reyes
这个回答解决了你的问题吗?ggplot2:在极坐标下用直线连接点2 - psychOle
1个回答

6

尝试这个方法,但请注意这只是一种临时的解决方案,未来可能无法使用。

example <- data.frame(c(5,4,3),c(0.9,1.1,0.6))

colnames(example) <- c("r", "theta")
is.linear.polar2 <- function(x) TRUE
coord_polar2 <-   coord_polar(theta="y", start = 3/2*pi, direction=-1) 
class(coord_polar2) <- c("polar2", class(coord_polar2))

myplot <- ggplot(example, aes(r, theta)) + geom_point(size=3.5) +
  coord_polar2+
  scale_x_continuous(breaks=seq(0,max(example$r)), lim=c(0, max(example$r))) + 
  scale_y_continuous(breaks=round(seq(0, 2*pi, by=pi/4),2), expand=c(0,0), lim=c(0,2*pi)) +
  geom_text(aes(label=rownames(example)), size=4.4, hjust=0.5, vjust=-1) + 
  geom_path()

enter image description here


谢谢kohske!我对使用ggplot2还比较新,所以希望您能解释一下is.linear.polar2 <- function(x) TRUEclass(coord_polar2) <- c("polar2", class(coord_polar2))各自是如何实现直线的。 - Maria Reyes
@Maria 这些是ggplot2的深层内部,因此在这里很难解释。 - kohske
没问题!谢谢kohske! - Maria Reyes

网页内容由stack overflow 提供, 点击上面的
可以查看英文原文,
原文链接