数据:
df<-data.frame(grp=letters[1:4],perc=runif(4))
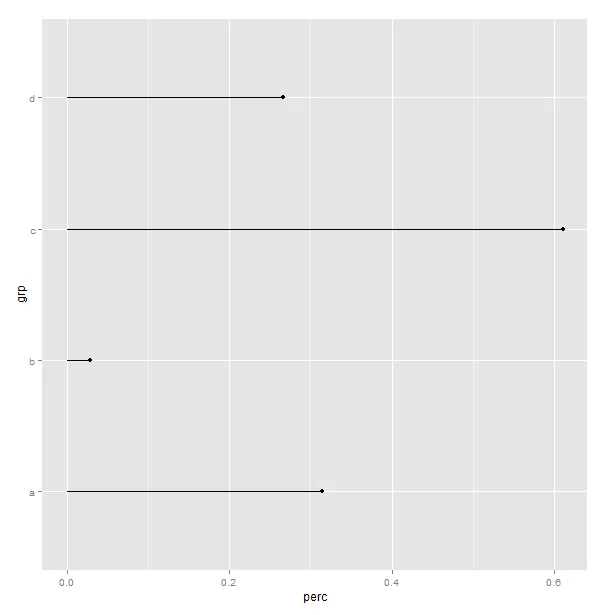
第一选项:
首先,创建一个包含每个组的零的第二个数据集
df2<-rbind(df,data.frame(grp=df[,1],perc=c(0,0,0,0)))
然后使用geom_points和geom_line进行绘图:
ggplot(df,aes(y=perc,x=grp))+
  geom_point()+
  geom_line(data=df2, aes(y=perc, x=grp))+
  coord_flip()
这看起来很好。只是创建第二个数据集需要太多额外的工作。
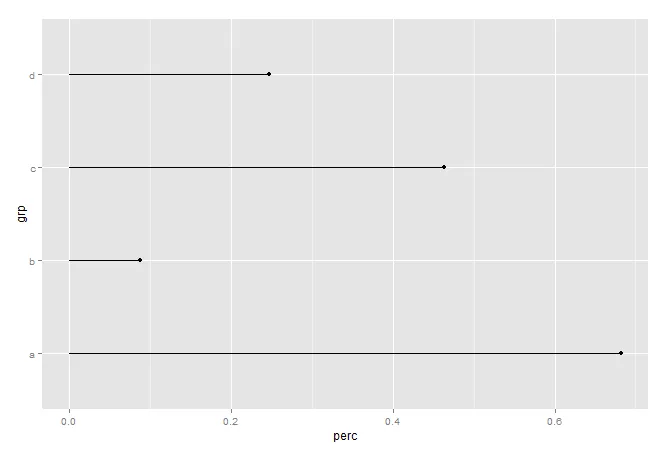
另一个选择是使用geom_bar并将宽度设置得很小:
ggplot(df,aes(y=perc,x=grp))+
  geom_point()+
  geom_bar(stat="identity",width=.01)+
  coord_flip()
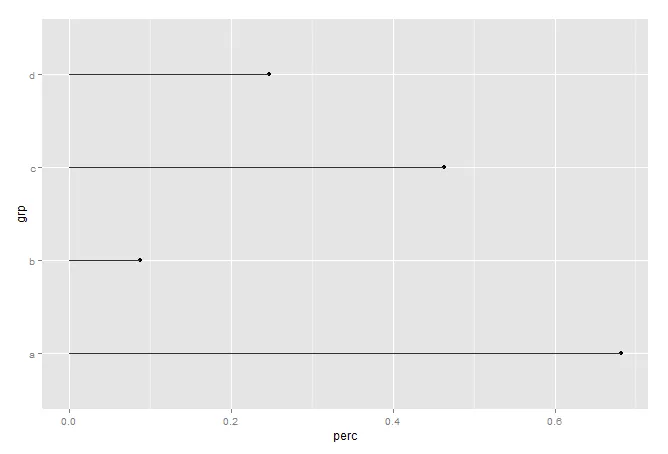
但这也很奇怪,当我保存为.pdf时,并非所有的条都是同样的宽度。
显然应该有更简单的方法来做到这一点,有什么建议吗?