ggplot2:绘制两个变量(线和点)并对齐两个图表

4

我最近开始使用ggplot2,但是我发现有很多困难......目前我只想用点和线(在plot函数中type=both)绘制两个不同的变量到一个图中,并将这个结果图放置并与一个共享相同x轴的直方图对齐。

所以我有这个数据框:

GO.df <- data.frame(GO.ID=paste("GO",c(1:29),sep=""),
                    occ=c(1:29),
                    pv=c(5.379594e-05, 3.052953e-03, 3.052953e-03, 3.052953e-03, 3.052953e-03, 3.052953e-03, 3.052953e-03, 3.052953e-03, 6.096906e-03, 6.096906e-03, 6.096906e-03, 6.096906e-03, 9.131884e-03, 9.131884e-03, 9.131884e-03, 9.131884e-03, 9.131884e-03, 9.131884e-03, 9.131884e-03, 1.215791e-02, 1.215791e-02, 1.215791e-02, 1.517502e-02, 1.517502e-02, 1.517502e-02, 1.517502e-02, 1.818323e-02, 1.818323e-02, 1.818323e-02),
                    adj.pv=c(0.004088492, 0.029003053, 0.029003053, 0.029003053, 0.029003053, 0.029003053, 0.029003053, 0.029003053, 0.036527537, 0.036527537, 0.036527537, 0.036527537, 0.036527537, 0.036527537, 0.036527537, 0.036527537, 0.036527537, 0.036527537, 0.036527537, 0.042000065, 0.042000065, 0.042000065, 0.044357749, 0.044357749, 0.044357749, 0.044357749, 0.047652596, 0.047652596, 0.047652596))

希望能够复制这个:

plot(GO.df$pv, type="b", col="red", ylim=c(0,0.05),ylab="",xlab="",xaxt="n")
lines(GO.df$adj.pv, type="b", col="blue")
axis(1, at=c(1:length(GO.df$GO.ID)), labels=GO.df$GO.ID, las=2)

在直方图上方(变量“occ”)并与其对齐。 使用ggplot2,我已经完成了以下内容:

#install.packages("ggplot2")
library(ggplot2)
#install.packages("reshape")
library(reshape)
#install.packages("gridExtra")
library(gridExtra)

GO.df2 <- melt(GO.df, measure.vars=c("pv", "adj.pv"))
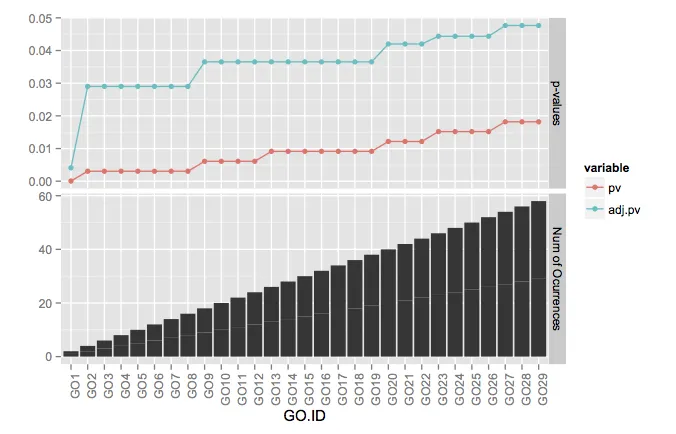
p1 <- ggplot(GO.df2, aes(x=GO.ID, y=value, colour=variable)) + geom_point() + ylab("p-values") + xlab(NULL)
p2 <- ggplot(GO.df2, aes(x=GO.ID, y=occ)) + geom_bar(stat="identity") + ylab("Num of Ocurrences")
grid.arrange(
  p1, 
  p2,
  nrow = 2,
  main = textGrob("GO!", vjust = 1, gp=gpar(fontface = "bold", cex = 1.5)))
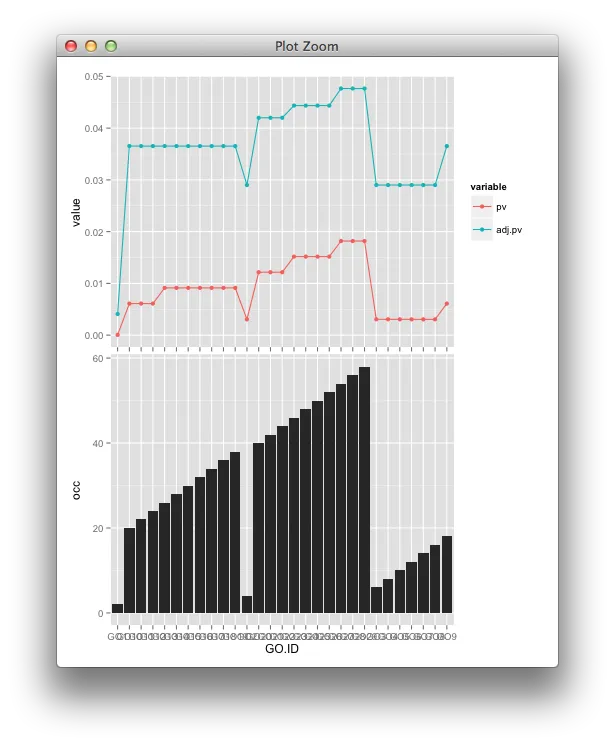
如您所见,我无法完成以下任务:
1- 绘制两条线和点
2- 数据不会散开,而是按正确的顺序排序(使用plot函数维护顺序)在两个图中。
3- 两个图对齐且之间有最小距离,并且上面一个图中没有x轴。
4- 使两个图对齐,但仍然保留上面图的图例。
希望您能帮助我解决这个问题,我对ggplots2还很陌生。非常感谢!
2个回答

6

我可能不会使用grid.arrange,而更倾向于这样做:

    dat <- rbind(GO.df2,GO.df2)
    dat$grp <- factor(rep(c('p-values','Num of Ocurrences'),each = nrow(GO.df2)),
                      levels = c('p-values','Num of Ocurrences'))
    dat$GO.ID <- factor(dat$GO.ID,levels = unique(dat$GO.ID))

ggplot(dat,aes(x = GO.ID)) + 
    facet_grid(grp~.,scales = "free_y") +
    geom_point(data = subset(dat,grp == 'p-values'),
               aes(y = value,colour = variable)) + 
    geom_line(data = subset(dat,grp == 'p-values'),
              aes(y = value,colour = variable,group = variable)) + 
    geom_bar(data = subset(dat,grp == 'Num of Ocurrences'),
             aes(y = occ),stat = "identity") + 
    theme(axis.text.x = element_text(angle = 90, hjust = 1)) +
    ylab("")

输入图像描述

为了绘制这些线,只需要添加geom_line并确保正确设置分组。

如同ggplot中的其他一切一样,想要对x轴进行排序只需要创建因子并正确排序级别即可。

调整图表对齐位置稍微有点棘手。使用分面尝试让大部分的对齐工作自动完成会有所帮助。为此,我们可以将您的数据rbind两次,创建一个代表不同y轴标签的分组变量。

然后,我们可以使用facet_grid强制分面条形图在y轴上,并允许自由y比例,然后仅向每个几何图形传递相应的数据子集。

感谢agstudy提醒我使用theme旋转x轴标签。


非常感谢,这个解决方案看起来非常不错。然而,值仍然是“分散的”,而不是有序的...是否可能在图例中添加一个代表“出现次数”的黑色正方形(以及删除“变量”标签)? - DaniCee
@DaniCee 这是我的疏忽,现在已经修复了排序。 - joran
或者,您可以将图例放在上面的绘图区域,而不是黑盒子中,这样可行吗? - DaniCee
@DaniCee 要删除“变量” + theme(legend.title=element_blank()) - agstudy
@DaniCee请查看?theme。您将需要仔细研究的选项列表很长,其中包括 legend.positionlegend.direction - joran

2
如果您想对每个图表进行更多的个性化控制,可以选择使用另一种方法而不是虚拟分面。
library(gtable) ; library(grid)

p1 <- qplot(GO.ID, value, colour=variable, group = variable, 
            data = GO.df2, geom=c("point", "line")) +
  theme(plot.margin = unit(c(1, 1, -0.5, 0.5), "lines"),
        axis.title.x = element_blank(),
        axis.text.x = element_blank())

p2 <- qplot(GO.ID, occ, data = GO.df2, geom="bar", stat="identity") +
  theme(plot.margin = unit(c(0, 1, 0.5, 0.5), "lines"))

g1 <- ggplotGrob(p1)
g2 <- ggplotGrob(p2)
g2 <- gtable::gtable_add_cols(g2, widths=unit(0,"mm"))
g <- gtable:::rbind_gtable(g1, g2, "first")

grid.newpage()
grid.draw(g)

enter image description here


网页内容由stack overflow 提供, 点击上面的
可以查看英文原文,
原文链接