如何使用
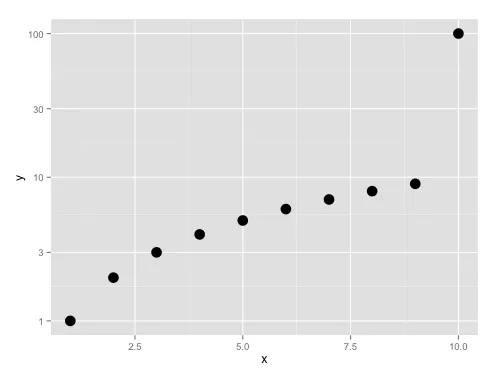
ggplot2缩放轴,并从特定点开始。假设我们有一个范围从0到100的范围,大多数值在1到10的范围内,而一个值在100处。require('data.table')
require('ggplot2')
test <- data.table(x=1:10,y=c(seq(1,9),100))
ggplot(test, aes(x=x,y=y)) + geom_point(size=5)
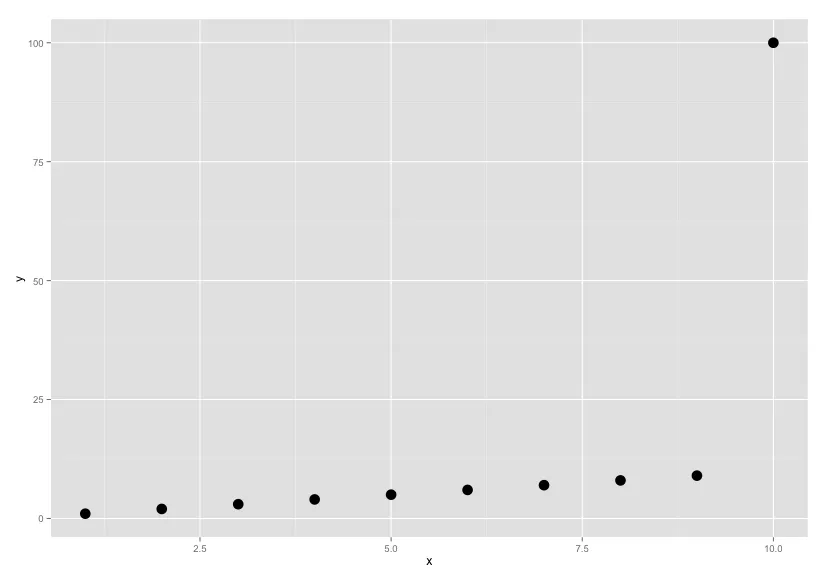
1到10,间隔为1,之后再按10递增,这样值为9和100之间的空间在图表中会变得“更小”。
更新:
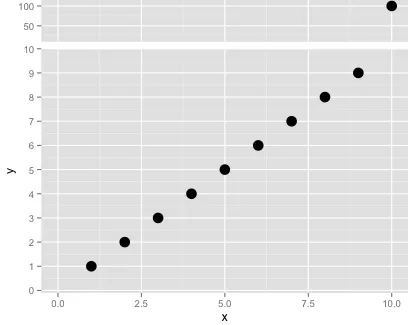
eipi10的方法完美地实现了我的目标。只有一个问题困扰着我:如何去掉第二个图例并保持最终图表的正确比例?
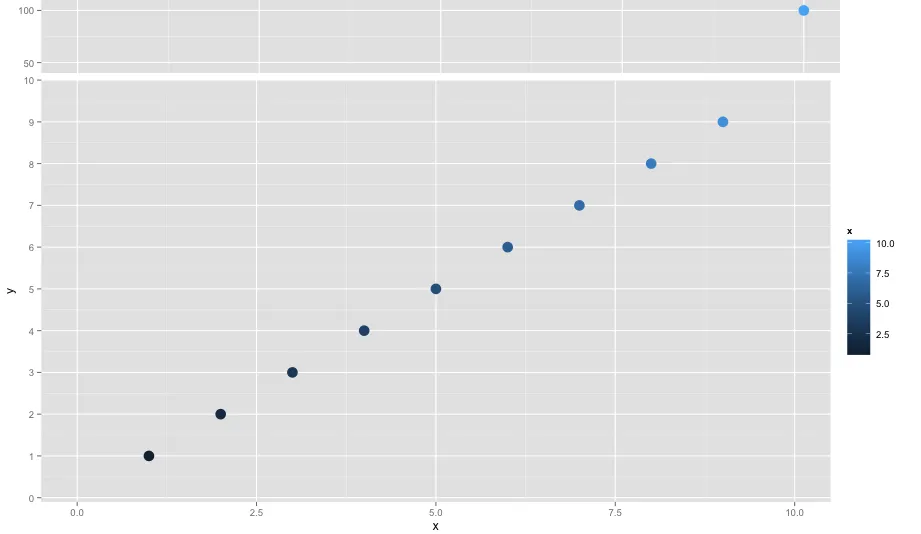
以及绘图的代码:
test <- data.table(x=1:10,y=c(seq(1,9),100))
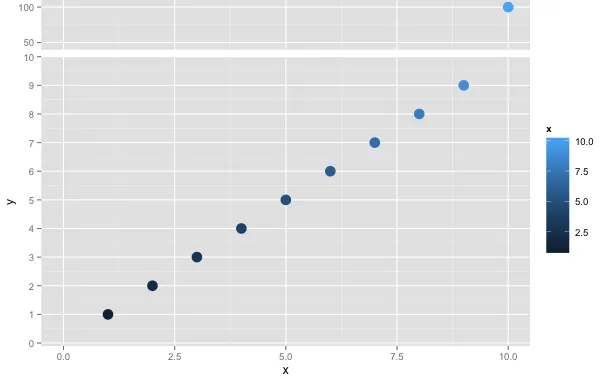
p1 = ggplot(test, aes(x=x,y=y,color=x)) +
geom_point(size=5) +
scale_x_continuous(limits=c(0,10)) +
coord_cartesian(ylim=c(-0.1,10)) +
scale_y_continuous(breaks=0:10) +
theme(plot.margin=unit(c(0,0.5,0,0),"lines"))
p2 = ggplot(test, aes(x=x,y=y,color=x)) +
geom_point(size=5) + #geom_point(size=5,show.legend=FALSE) +
scale_x_continuous(limits=c(0,10)) +
coord_cartesian(ylim=c(40,110)) +
scale_y_continuous(breaks=c(50,100)) +
theme(plot.margin=unit(c(0,0.5,-0.5,0), "lines"),
axis.title.x=element_blank(),
axis.ticks.x=element_blank(),
axis.text.x=element_blank(),
legend.position="none") +
labs(y="")
gA <- ggplotGrob(p1)
gB <- ggplotGrob(p2)
maxWidth = grid::unit.pmax(gA$widths[2:5], gB$widths[2:5])
gA$widths[2:5] <- as.list(maxWidth)
gB$widths[2:5] <- as.list(maxWidth)
grid.arrange(gB, gA, ncol=1, heights=c(0.15,0.85))
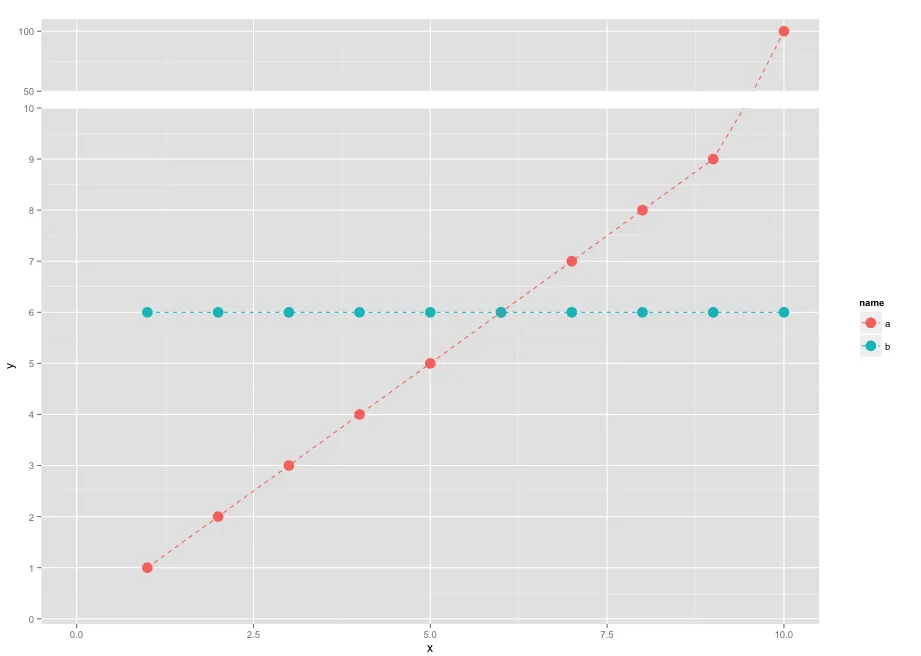
更新2:
下面是最终结果的一个例子。再次感谢eipi10及其出色的支持!