我想绘制一张只包含数据而没有任何其他信息的图表。没有坐标轴、网格线或标题,仅为纯数据图。
但是我总是会得到一些无法去除的额外边距和填充。
library(ggplot2)
library(grid)

theme_bare <- theme(
  axis.line = element_blank(),
  axis.text.x = element_blank(),
  axis.text.y = element_blank(),
  axis.ticks = element_blank(),
  axis.title.x = element_blank(),
  axis.title.y = element_blank(),
  #axis.ticks.length = unit(0, "lines"), # Error
  axis.ticks.margin = unit(c(0,0,0,0), "lines"),
  legend.position = "none",
  panel.background = element_rect(fill = "gray"),
  panel.border = element_blank(),
  panel.grid.major = element_blank(),
  panel.grid.minor = element_blank(),
  panel.margin = unit(c(0,0,0,0), "lines"),
  plot.background = element_rect(fill = "blue"),
  plot.margin = unit(c(0,0,0,0), "lines")
)

ggplot() +
  geom_area (data=economics, aes(x = date, y = unemploy), linetype=0) +
  theme_bare
生成这张图片: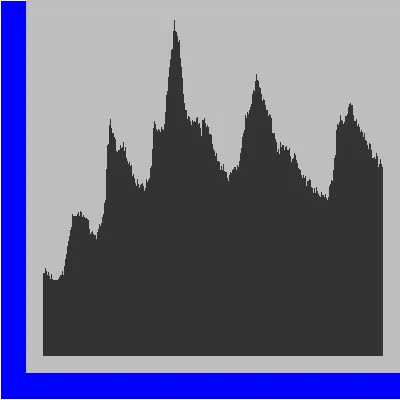
我想要的是这个: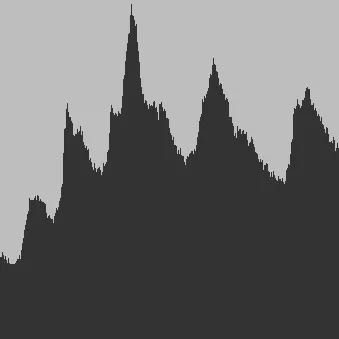
我不知道该如何去掉蓝色并让深灰色贴近边缘。
有人可以给些建议吗?
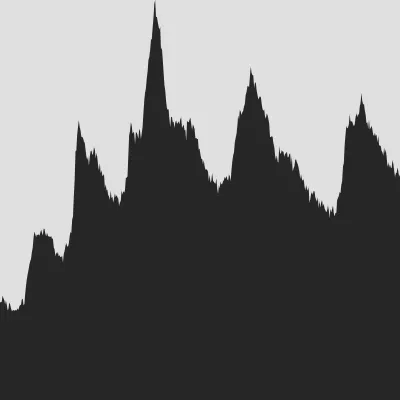
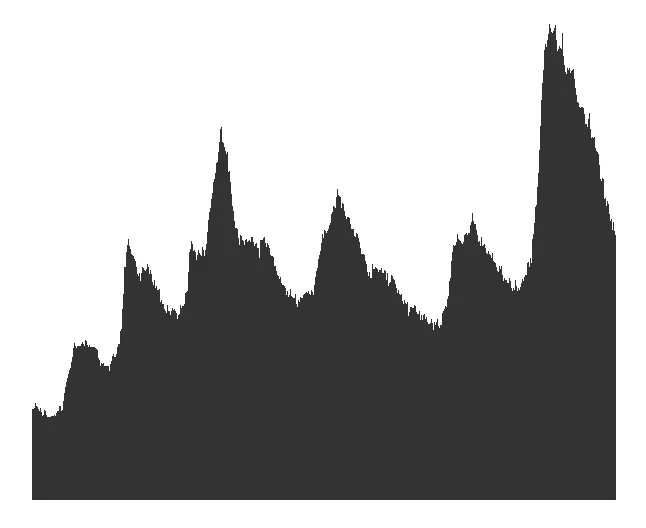
scale_*_*(expand = c(0,0))。 - joran+ scale_x_continuous(expand = c(0,0)) + scale_y_continuous(expand = c(0,0)),但是无论我使用连续或离散,它都显示“离散值提供给连续比例尺”。 - sharozscale_*_*(expand = c(0,0))函数可以去除图表外部的灰色,但对蓝色无效。 - sebastian-c