我想使用Bioconductor的hexbin(我可以做到)来生成一个填满整个(png)显示区域的图表 - 没有坐标轴,没有标签,没有背景。
9个回答
226
根据我在Chase答案中的评论,你可以使用element_blank来移除很多这些内容:
dat <- data.frame(x=runif(10),y=runif(10))

p <- ggplot(dat, aes(x=x, y=y)) +
        geom_point() +
        scale_x_continuous(expand=c(0,0)) +
        scale_y_continuous(expand=c(0,0))

p + theme(axis.line=element_blank(),axis.text.x=element_blank(),
          axis.text.y=element_blank(),axis.ticks=element_blank(),
          axis.title.x=element_blank(),
          axis.title.y=element_blank(),legend.position="none",
          panel.background=element_blank(),panel.border=element_blank(),panel.grid.major=element_blank(),
          panel.grid.minor=element_blank(),plot.background=element_blank())
保存为.png文件时,似乎仍然在周围有一个小边距。也许有人知道如何去除这一部分。
(历史注:自ggplot2版本0.9.2起,opts已被弃用。请改用theme(),并将theme_blank()替换为element_blank()。)
- joran
3
1非常感谢!我也在http://groups.google.com/group/ggplot2/browse_thread/thread/72403c6997b79c3b找到了一个类似的解决方案。 - user1320487
顺带一提:在某些情况下,“theme(axis.ticks=element_blank())”不如“theme(axis.ticks.x=element_blank())”有效,可能是某个临时 bug(我有自己的主题设置,然后尝试覆盖:只有
axis.ticks.x和axis.ticks.y有效)。 - PatrickT我成功地通过以下代码去掉了多余的边距:
theme(plot.margin=grid::unit(c(0,0,0,0), "mm")) - undefined123
关于将opts改为theme等(懒人专用)的回复:
theme(axis.line=element_blank(),
      axis.text.x=element_blank(),
      axis.text.y=element_blank(),
      axis.ticks=element_blank(),
      axis.title.x=element_blank(),
      axis.title.y=element_blank(),
      legend.position="none",
      panel.background=element_blank(),
      panel.border=element_blank(),
      panel.grid.major=element_blank(),
      panel.grid.minor=element_blank(),
      plot.background=element_blank())
- mbjoseph
1
1虽然另一个答案中提供的
theme_void是实现OP目标最简单的方法,但如果与facet_grid或facet_wrap结合使用,您还将失去围绕分面标签的框。如果您不希望发生这种情况,那么这个答案就是要使用的。 - EcologyTom86
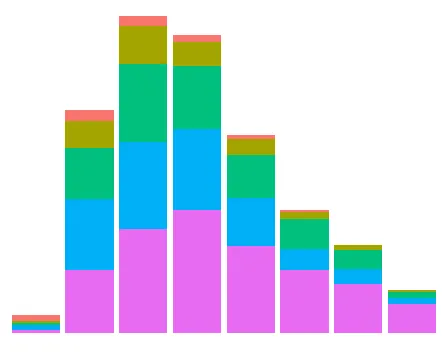
目前的答案要么不完整,要么效率低下。以下是(也许)使用theme_void()实现结果的最短方式:
Current answers are either incomplete or inefficient. Here is (perhaps) the shortest way to achieve the outcome (using theme_void():
data(diamonds) # Data example
ggplot(data = diamonds, mapping = aes(x = clarity)) + geom_bar(aes(fill = cut)) +
      theme_void() + theme(legend.position="none")
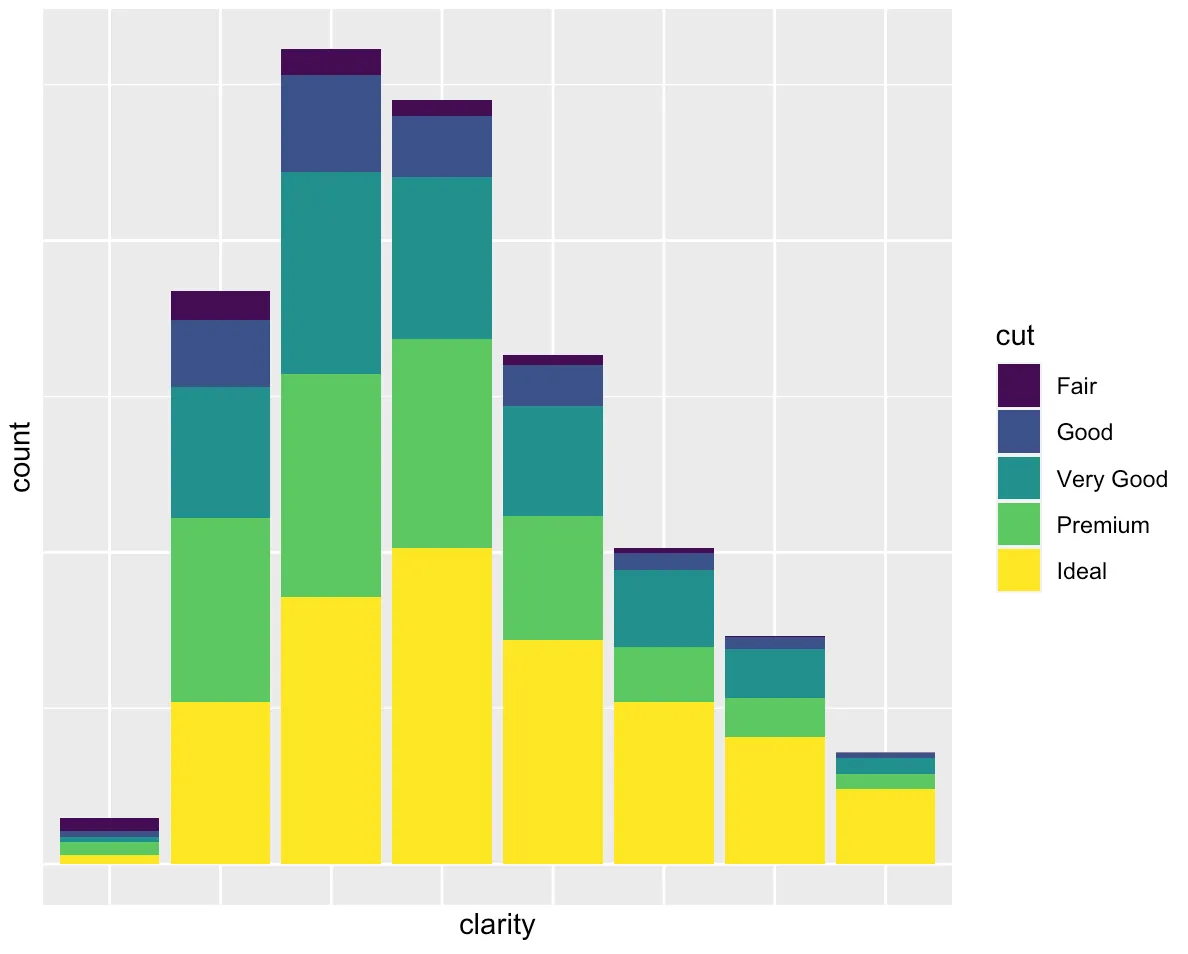
如果你只想消除标签,labs(x="", y="")可以解决问题:
ggplot(data = diamonds, mapping = aes(x = clarity)) + geom_bar(aes(fill = cut)) +
      labs(x="", y="")
- luchonacho
5
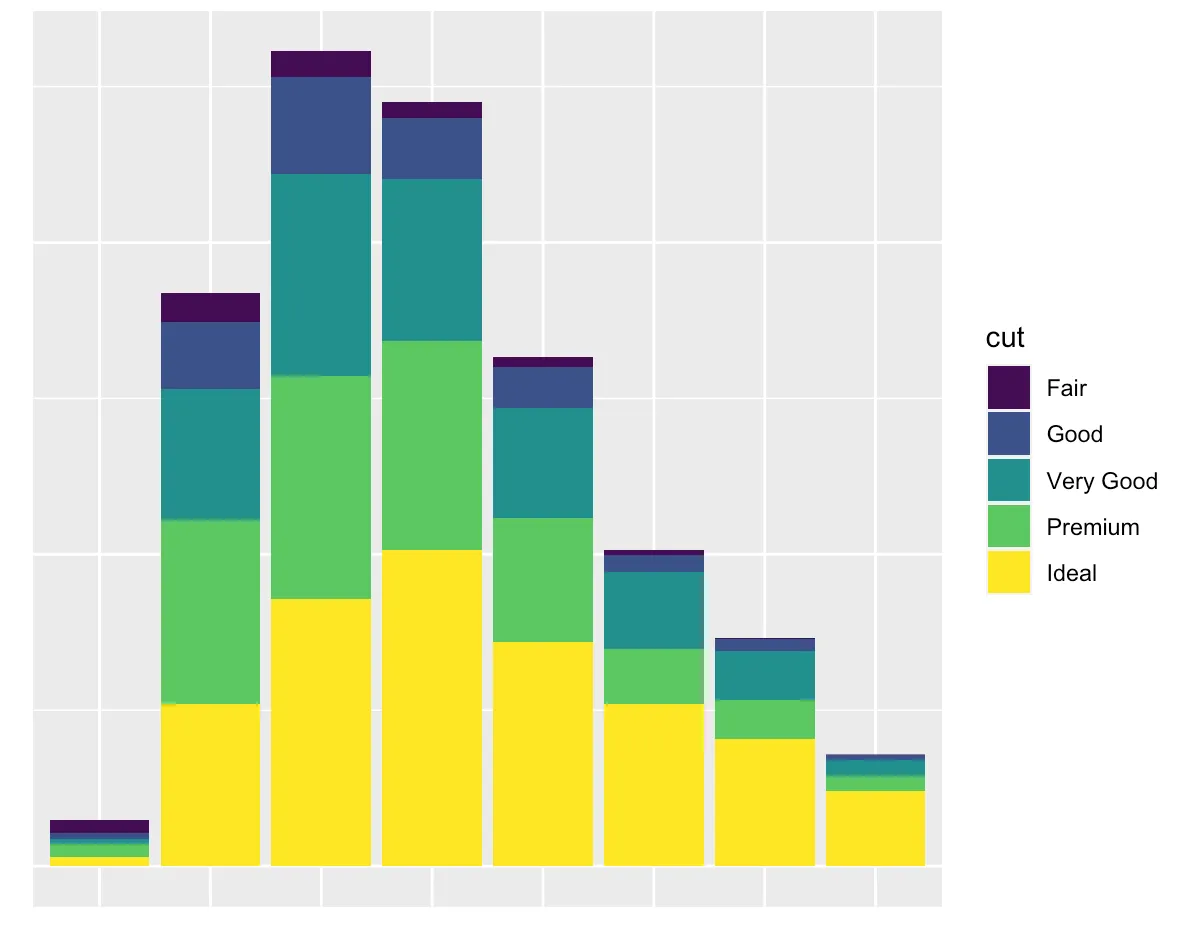
ggplot(data = diamonds, mapping = aes(x = clarity)) + geom_bar(aes(fill = cut)) +
theme_void() +
theme(legend.position="none",
panel.background = element_rect(fill="grey80"),
plot.background = element_rect(fill="red")) 表明它并非完全为空。 - baptiste
1这个实验室(x =“”,y =“”)似乎没有移除坐标轴,只是标签。 - miratrix
@miratrix 抱歉,是我的错误。已更新。 - luchonacho
7使用
labs(x="", y="") 会在坐标轴标题处留下空白,因为实际上这些标题是存在的,只是没有显示。要移除坐标轴标题及其所占的空间,最好使用 + theme(axis.title = element_blank())。 - Didzis Elferts7
labs(x = NULL) 或 xlab(NULL) 是其他的方式。 - PatrickT43
'opts' is deprecated.
在ggplot2 >= 0.9.2版本中使用
p + theme(legend.position = "none")
- Jonas Stein
1
6我知道你目前还没有编辑权限,但如果你发现我其他关于ggplot2的回答需要更新关于opts()的部分,请随时建议编辑。我会收到通知并自己进行修改。 - joran
11
虽然有点晚,但可能会引起兴趣...
我发现在许多情况下,labs 和 guides 规范的组合非常有用:
你只需要一个网格和一个背景:
ggplot(diamonds, mapping = aes(x = clarity)) +
  geom_bar(aes(fill = cut)) +
  labs(x = NULL, y = NULL) +
  guides(x = "none", y = "none")
您希望仅抑制一个或两个轴的刻度标签:
ggplot(diamonds, mapping = aes(x = clarity)) +
  geom_bar(aes(fill = cut)) +
  guides(x = "none", y = "none")
- symbolrush
3
使用ggeasy,它更简单。
library(ggeasy)
p + theme_classic()+easy_remove_axes() + easy_remove_legend()
- Sandy
3
xy <- data.frame(x=1:10, y=10:1)
plot <- ggplot(data = xy)+geom_point(aes(x = x, y = y))
plot
panel = grid.get("panel-3-3")

grid.newpage()
pushViewport(viewport(w=1, h=1, name="layout"))
pushViewport(viewport(w=1, h=1, name="panel-3-3"))
upViewport(1)
upViewport(1)
grid.draw(panel)
- amaurel
4
Error in UseMethod("grid.draw") : no applicable method for 'grid.draw' applied to an object of class "NULL" - Roman Luštrikgrid.ls() 显示视口和图形对象列表。 - amaurel
看起来我使用的ggplot的另一个版本中,面板名称不同。 - amaurel
xy <- data.frame(x=1:10, y=10:1)
plot <- ggplot(data = xy)+geom_point(aes(x = x, y = y))
plot
panel = grid.get("panel-3-4")grid.newpage()
pushViewport(viewport(w=1, h=1, name="layout"))
pushViewport(viewport(w=1, h=1, name="panel-3-4"))
upViewport(1)
upViewport(1)
grid.draw(panel) - amaurel
1
我在这里没有找到这个解决方案。使用cowplot包可以将其全部删除:
library(cowplot)

p + theme_nothing() +
theme(legend.position="none") +
scale_x_continuous(expand=c(0,0)) +
scale_y_continuous(expand=c(0,0)) +
labs(x = NULL, y = NULL)
刚刚注意到可以使用theme.void()来完成同样的事情,像这样:
p + theme_void() +
theme(legend.position="none") +
scale_x_continuous(expand=c(0,0)) +
scale_y_continuous(expand=c(0,0)) +
labs(x = NULL, y = NULL)
- John T
0
这个做你想要的吗?
 p <- ggplot(myData, aes(foo, bar)) + geom_whateverGeomYouWant(more = options) +
 p + scale_x_continuous(expand=c(0,0)) +
 scale_y_continuous(expand=c(0,0)) +
 opts(legend.position = "none")
- Chase
1
去掉图例,但x和y轴以及背景网格仍然存在。 - user1320487
网页内容由stack overflow 提供, 点击上面的可以查看英文原文,
原文链接
原文链接
theme_void()。 - Brian D