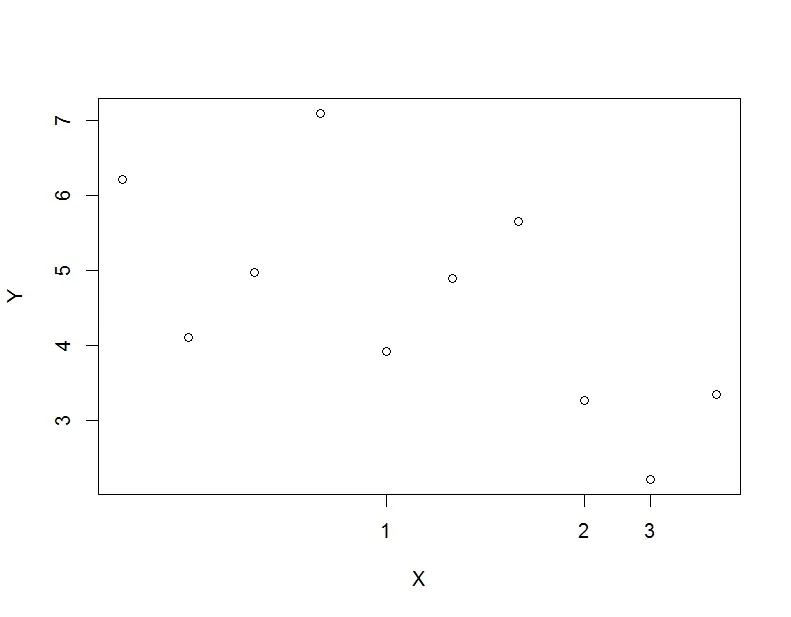
这里是数据。
X <- 1:10
Y <- rnorm (length(X), 5, 2)
ticks <- data.frame (t = c(5, 8, 9), l = c(1:3))

plot (X, Y, xaxt = "n")

axis(1, at = ticks$t, labels = ticks$l)
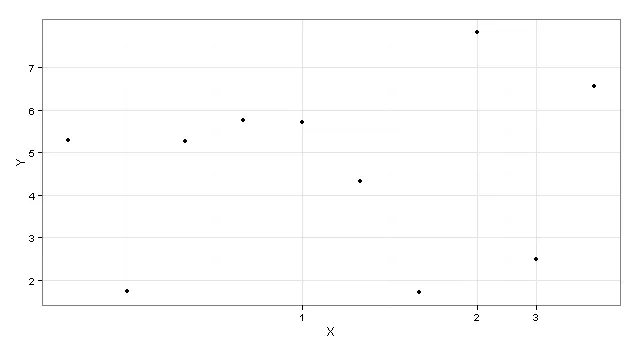
我希望在ggplot2中完成类似的工作。我该怎么做?
library(ggplot2)

X <- 1:10
Y <- rnorm (length(X), 5, 2)
ticks <- data.frame (t = c(5, 8, 9), l = c(1:3))

df <- data.frame(X, Y)


p <- ggplot(data=df, aes(x = X,y = Y) )
p <- p + scale_x_continuous(breaks=c(ticks$t),
                            labels=c(ticks$l))
p <- p + geom_point()
p <- p + theme_bw()
p