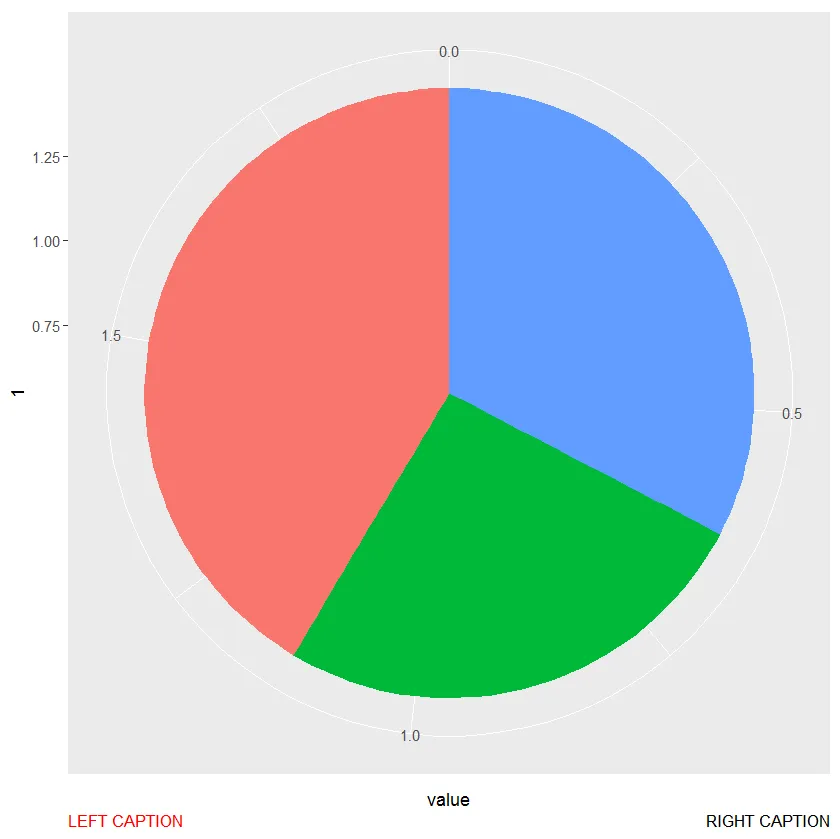
我被要求使用ggplot2重新创建一个饼图,但是在向图表添加第二个标题时遇到了困难。我需要在图表的左下角和右下角分别添加标题。
我当前的方法可以通过使用hjust选项来获得其中之一的标题位置(0表示左对齐;1表示右对齐):
library(ggplot2)
dat <- data.frame(variable = c("V1", "V2", "V3"),
value = c(.80,.50,.63))
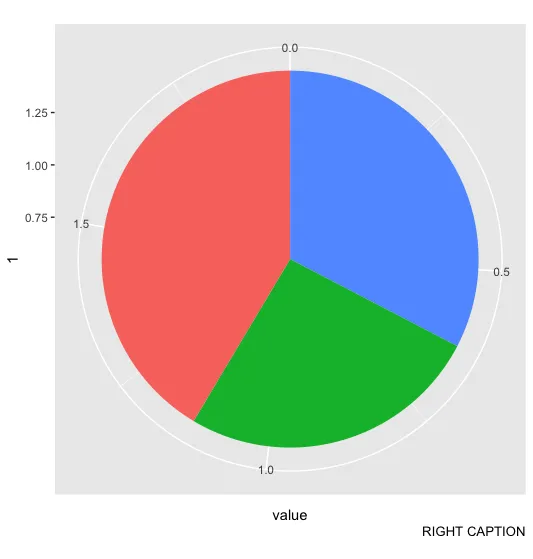
p1 <- ggplot(dat,
aes(x = 1, y = value, fill = variable)) +
geom_bar(stat = "identity") +
coord_polar(theta = "y") +
theme(legend.position = 'none',
plot.caption = element_text(hjust = 1)) +
labs(caption = "RIGHT CAPTION")
print(p1)
这将产生以下结果:
annotate(),但我似乎无法与coord_polar()一起使用。有人知道如何在绘图的左侧出现第二个标题(与右标题水平对齐)吗?也许可以叠加一个只有左标题的空白层?