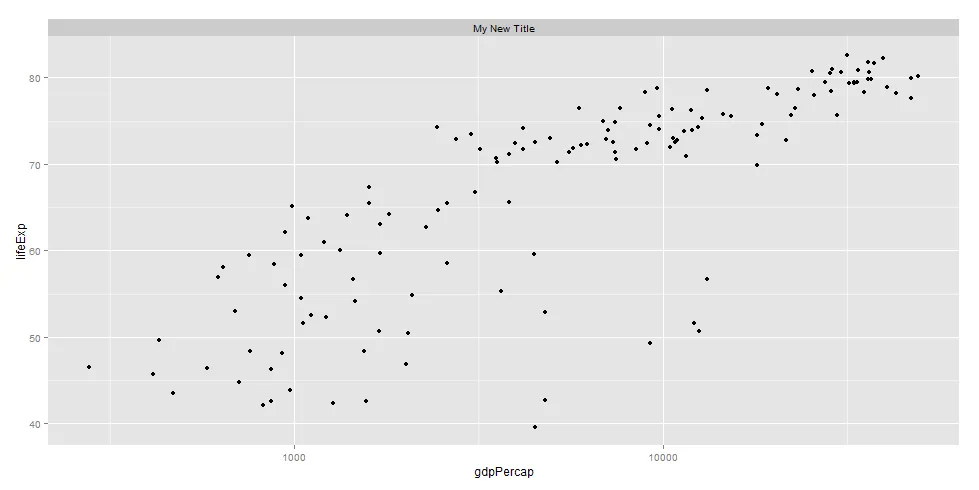
可以为单个图形添加标题,例如:
library(ggplot2)
gdURL <- "http://www.stat.ubc.ca/~jenny/notOcto/STAT545A/examples/gapminder/data/gapminderDataFiveYear.txt"
gDat <- read.delim(file = gdURL)
jDat <- droplevels(subset(gDat, continent != "Oceania"))
str(jDat)
jYear <- 2007
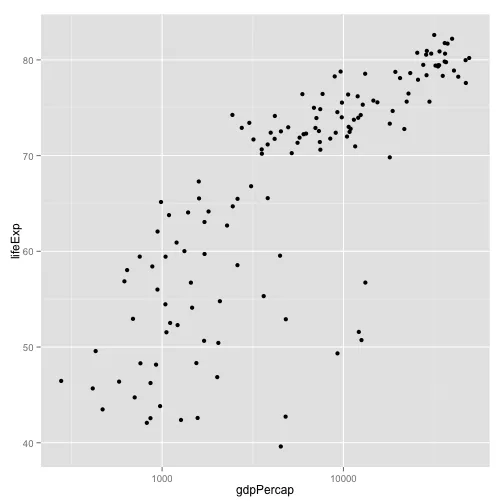
q <- ggplot(subset(jDat, year == jYear),
aes(x = gdpPercap, y = lifeExp)) + scale_x_log10()
q + geom_point()
q + geom_point(aes(size = sqrt(pop/pi)), pch = 21)
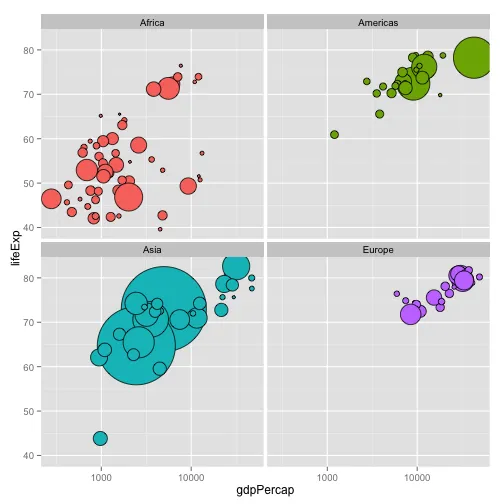
如果要在像这样的 facet_wrap 图中显示标题(以灰色框和图表集成的形式)应该怎么做?
注:facet_wrap 是 ggplot2 包中的一个函数,用于绘制多个子图。
r <- q +
   geom_point(aes(size = sqrt(pop/pi)), pch = 21, show_guide = FALSE) +
   scale_size_continuous(range=c(1,40))

r <- r + facet_wrap(~ continent)
r + aes(fill = continent)