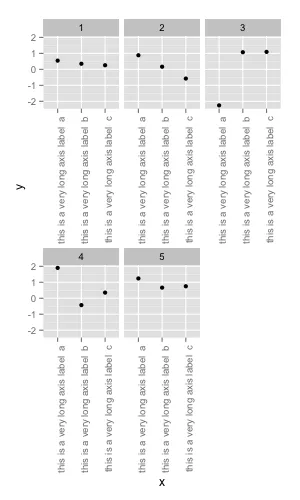
如果我没记错的话,有人问如何将所有标签添加到最后一列下的同一行以及如何将这些最后的标签提升到下一行。所以这里是两种情况的函数:
编辑:由于这类似于
print.ggplot的替代品(请参见
getAnywhere(print.ggplot)),因此我已经添加了一些代码来保留功能。
编辑2:我进一步改进了它:不再需要指定
nrow和
ncol,也可以打印具有所有面板的图形。
library(grid)
facetAdjust <- function(x, pos = c("up", "down"),
newpage = is.null(vp), vp = NULL)
{
ggplot2:::set_last_plot(x)
if(newpage)
grid.newpage()
pos <- match.arg(pos)
p <- ggplot_build(x)
gtable <- ggplot_gtable(p)
dims <- apply(p$panel$layout[2:3], 2, max)
nrow <- dims[1]
ncol <- dims[2]
panels <- sum(grepl("panel", names(gtable$grobs)))
space <- ncol * nrow
n <- space - panels
if(panels != space){
idx <- (space - ncol - n + 1):(space - ncol)
gtable$grobs[paste0("axis_b",idx)] <- list(gtable$grobs[[paste0("axis_b",panels)]])
if(pos == "down"){
rows <- grep(paste0("axis_b\\-[", idx[1], "-", idx[n], "]"),
gtable$layout$name)
lastAxis <- grep(paste0("axis_b\\-", panels), gtable$layout$name)
gtable$layout[rows, c("t","b")] <- gtable$layout[lastAxis, c("t")]
}
}
if(is.null(vp)){
grid.draw(gtable)
}
else{
if (is.character(vp))
seekViewport(vp)
else pushViewport(vp)
grid.draw(gtable)
upViewport()
}
invisible(p)
}
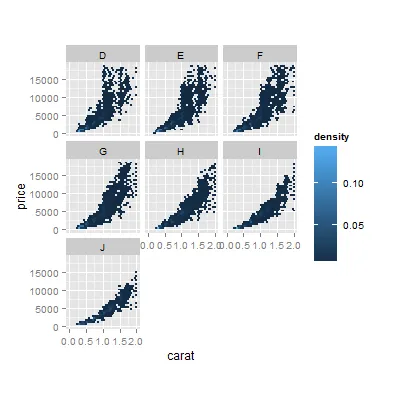
这是它的外观
d <- ggplot(diamonds, aes(carat, price, fill = ..density..)) +
  xlim(0, 2) + stat_binhex(na.rm = TRUE) + theme(aspect.ratio = 1) +
  facet_wrap(~ color)
facetAdjust(d)
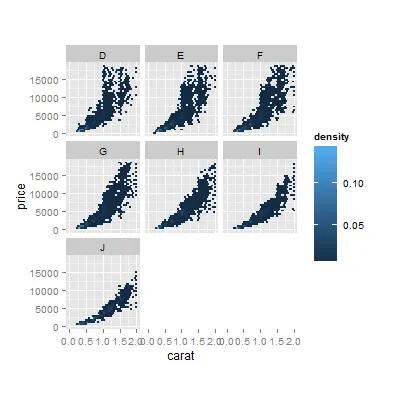
facetAdjust(d, "down")
编辑3:
这是一种替代方案,上面的方案也不错。
当使用ggsave和facetAdjust时会出现一些问题。需要一个ggplot类的绘图,因为在ggsave源代码的两个部分中都有print(plot)和default_name(plot)。如果没有手动提供文件名(根据?ggsave,它似乎不应该工作),则需要给定一个类别。因此,给定一个文件名,有一个解决方法(可能在某些情况下会产生副作用):
首先,让我们考虑实现浮动轴的单独函数。通常,它会返回一个gtable对象,但是我们使用class(gtable) <- c("facetAdjust", "gtable", "ggplot")。这样,就允许使用ggsave和print(plot)按要求工作(请参见下面的print.facetAdjust)。
facetAdjust <- function(x, pos = c("up", "down"))
{
  pos <- match.arg(pos)
  p <- ggplot_build(x)
  gtable <- ggplot_gtable(p); dev.off()
  dims <- apply(p$panel$layout[2:3], 2, max)
  nrow <- dims[1]
  ncol <- dims[2]
  panels <- sum(grepl("panel", names(gtable$grobs)))
  space <- ncol * nrow
  n <- space - panels
  if(panels != space){
    idx <- (space - ncol - n + 1):(space - ncol)
    gtable$grobs[paste0("axis_b",idx)] <- list(gtable$grobs[[paste0("axis_b",panels)]])
    if(pos == "down"){
      rows <- grep(paste0("axis_b\\-[", idx[1], "-", idx[n], "]"),
                   gtable$layout$name)
      lastAxis <- grep(paste0("axis_b\\-", panels), gtable$layout$name)
      gtable$layout[rows, c("t","b")] <- gtable$layout[lastAxis, c("t")]
    }
  }
  class(gtable) <- c("facetAdjust", "gtable", "ggplot"); gtable
}
这个打印函数与ggplot2:::print.ggplot只有几行不同:
print.facetAdjust <- function(x, newpage = is.null(vp), vp = NULL) {
  if(newpage)
    grid.newpage()
  if(is.null(vp)){
    grid.draw(x)
  } else {
    if (is.character(vp))
      seekViewport(vp)
    else pushViewport(vp)
    grid.draw(x)
    upViewport()
  }
  invisible(x)
}
例子:
d <- ggplot(diamonds, aes(carat, price, fill = ..density..)) +
xlim(0, 2) + stat_binhex(na.rm = TRUE) + theme(aspect.ratio = 1) +
facet_wrap(~ color)
p <- facetAdjust(d)
print(p)
ggsave("name.pdf", p)