更改 ggplot2::facet_wrap 的标题,以避免使用默认值。

16
有没有可能改变facet_wrap变量的标签,如下所示。例如,我想要将cyl:4cyl:6cyl:8改为condition:4condition:6condition:8。当然,我可以通过重命名变量来实现这个目标,但这不是我想要的。这是一个更简单的自定义函数的版本,在这个函数中,我不能随意重命名变量。
换句话说,我是否有任何自由来任意标记facet_wrap?就像ggplot2中的x美学变量可以在数据框(mtcars)中具有某些名称(例如cyl),但我仍然可以使用labs(x="cylinder")替换它一样。我希望对于facet_wrap也能有类似的功能。
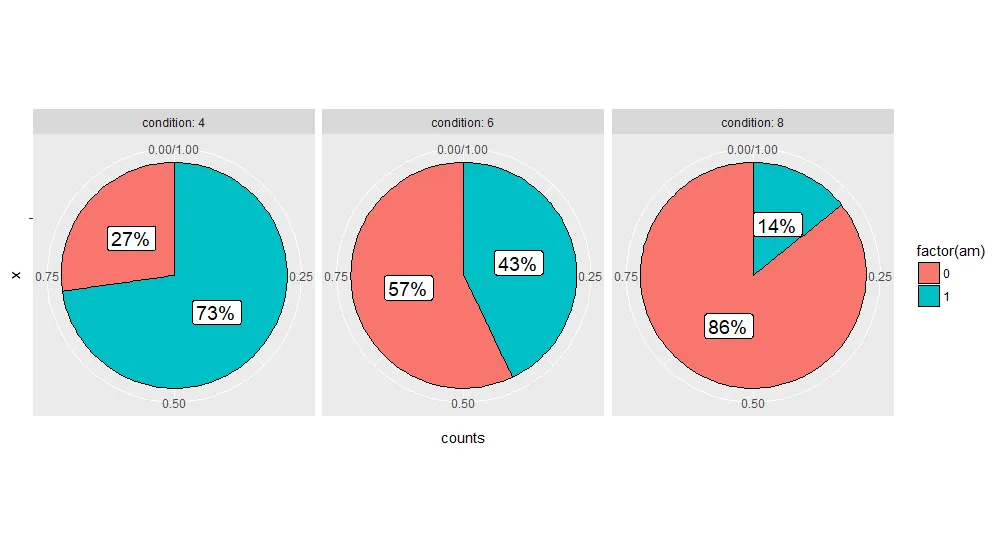
library(dplyr)
library(datasets)
library(ggplot2)
data(mtcars)

# creating a dataframe
df <- dplyr::group_by(mtcars, .dots = c('cyl', 'am')) %>%
  dplyr::summarize(counts = n()) %>%
  dplyr::mutate(perc = (counts / sum(counts)) * 100) %>%
  dplyr::arrange(desc(perc))

# preparing the plot
ggplot2::ggplot(df, aes('', counts)) +
  geom_col(
    position = 'fill',
    color = 'black',
    width = 1,
    aes(fill = factor(am))
  ) +
  facet_wrap(~cyl, labeller = "label_both") + # faceting by `cyl` variable
  geom_label(
    aes(label = paste0(round(perc), "%"), group = factor(am)),
    position = position_fill(vjust = 0.5),
    color = 'black',
    size = 5,
    show.legend = FALSE
  ) +
  coord_polar(theta = "y")

这段文字是由reprex包(v0.2.0)于2018年2月19日创建的。

2个回答

29

要更改分面标签,您可以在facet_wrap中的labeller参数中提供一个命名向量的标签:

labeller = labeller(cyl = 
    c("4" = "condition: 4",
      "6" = "condition: 6",
      "8" = "condition: 8"))

以下是完整的情节代码:

ggplot2::ggplot(df, aes('', counts)) +
  geom_col(
    position = 'fill',
    color = 'black',
    width = 1,
    aes(fill = factor(am))
  ) +
  facet_wrap(~cyl, labeller = labeller(cyl = 
    c("4" = "condition: 4",
      "6" = "condition: 6",
      "8" = "condition: 8")
  )) 
  geom_label(
    aes(label = paste0(round(perc), "%"), group = factor(am)),
    position = position_fill(vjust = 0.5),
    color = 'black',
    size = 5,
    show.legend = FALSE
  ) +
  coord_polar(theta = "y")

在此输入图片描述

基于评论的要求,需要一个返回标签的函数:

也许可以这样写:

label_facet <- function(original_var, custom_name){
  lev <- levels(as.factor(original_var))
  lab <- paste0(custom_name, ": ", lev)
  names(lab) <- lev
  return(lab)  
}


ggplot2::ggplot(df, aes('', counts)) +
  geom_col(
    position = 'fill',
    color = 'black',
    width = 1,
    aes(fill = factor(am))
  ) +
  facet_wrap(~cyl, labeller = labeller(cyl = label_facet(df$cyl, "grouping"))) +
geom_label(
  aes(label = paste0(round(perc), "%"), group = factor(am)),
  position = position_fill(vjust = 0.5),
  color = 'black',
  size = 5,
  show.legend = FALSE
) +
  coord_polar(theta = "y")

这里输入图片描述

sessionInfo()

R version 3.4.2 (2017-09-28)
Platform: x86_64-w64-mingw32/x64 (64-bit)
Running under: Windows >= 8 x64 (build 9200)

Matrix products: default

locale:
[1] LC_COLLATE=English_United States.1252  LC_CTYPE=English_United States.1252    LC_MONETARY=English_United States.1252
[4] LC_NUMERIC=C                           LC_TIME=English_United States.1252    

attached base packages:
[1] stats     graphics  grDevices utils     datasets  methods   base     

other attached packages:
[1] bindrcpp_0.2  ggplot2_2.2.1 dplyr_0.7.4   RMOA_1.0      rJava_0.9-9   RMOAjars_1.0 

loaded via a namespace (and not attached):
 [1] Rcpp_0.12.14      bindr_0.1         magrittr_1.5      munsell_0.4.3     colorspace_1.3-2  R6_2.2.2          rlang_0.1.4      
 [8] plyr_1.8.4        tools_3.4.2       grid_3.4.2        gtable_0.2.0      yaml_2.1.14       lazyeval_0.2.1    assertthat_0.2.0 
[15] digest_0.6.13     tibble_1.4.1      glue_1.2.0        labeling_0.3      compiler_3.4.2    pillar_1.0.1      scales_0.5.0.9000
[22] pkgconfig_2.0.1  

1
所以,基本上,我正在寻找一个函数,它将从两个因子变量创建一个饼图。这是实际的函数:https://github.com/IndrajeetPatil/ggstatsplot/blob/master/R/ggpiestats.R
它工作得很好。只是除了指定“标题”,“标题”和“图例标题”之外,我还希望用户能够以任何他们喜欢的方式重命名“facet_wrap”变量。由于目前的情况总是转换为名称“condition”。
- Indrajeet Patil
谢谢你的答复。我会尝试想办法将其泛化版本加入我的代码中。 - Indrajeet Patil
1
你的代码只需要修改一行就可以正常工作了! lab <- paste0(custom_name, ": ", lev) 你能否编辑这段代码以备将来参考或其他读者使用? - Indrajeet Patil
刚刚试了一下带非数字因子水平的修改版本,运行得很好。因此,至少根据我进行的初步测试,这似乎是很稳健的。 - Indrajeet Patil
@Indrajeet Patil,很好的发现!我在家里的电脑上重新运行了代码,问题已经不存在了,附上我的 sessionInfo()。我会更新来自工作电脑的 sessionInfo()。之前编辑过答案的部分是在工作电脑上完成的。 - missuse
显示剩余2条评论

4
你可以这样做:
  ggplot2::ggplot(df, aes('', counts)) +
  geom_col(
    position = 'fill',
    color = 'black',
    width = 1,
    aes(fill = factor(am))
  ) +
  facet_wrap(~cyl, labeller = as_labeller(c(`4` = "Condition: 4", `6` = "Condition: 6", `8` = "Condition: 8"))) + # faceting by `cyl` variable
  geom_label(
    aes(label = paste0(round(perc), "%"), group = factor(am)),
    position = position_fill(vjust = 0.5),
    color = 'black',
    size = 5,
    show.legend = FALSE
  ) +
  coord_polar(theta = "y")

网页内容由stack overflow 提供, 点击上面的
可以查看英文原文,
原文链接