我希望在几个ggplot对象的中心放置一个注释。
我已经进行了一些研究,并找到了一些类似的问题,例如这里:Relative positioning of geom_text in ggplot2? 到目前为止,我找到的唯一答案是操纵绝对范围(例如“,y = ymax / 2”)。
我想在打印到.pdf之前,在循环中添加注释层。 我可以使用+/- Inf将注释放置在角落中,如下所示:
我已经进行了一些研究,并找到了一些类似的问题,例如这里:Relative positioning of geom_text in ggplot2? 到目前为止,我找到的唯一答案是操纵绝对范围(例如“,y = ymax / 2”)。
我想在打印到.pdf之前,在循环中添加注释层。 我可以使用+/- Inf将注释放置在角落中,如下所示:
plot.list<-list()
g<- qplot(1,1)

plot.list[[length(plot.list)+1]]<-g
plot.list[[length(plot.list)+1]]<-g

pdf("MyReport.pdf"
    ,width = 14
    ,height=8.5
    ,paper="a4r")
for(i in 1:length(plot.list)){
  print(plot.list[[i]]+
          annotate("text",x=Inf,y=Inf,hjust=1,vjust=1
                   ,label="PLEASE DO NOT DISTRIBUTE"
                   ,fontface="bold",color="darkred",alpha=0.3))
}
dev.off()
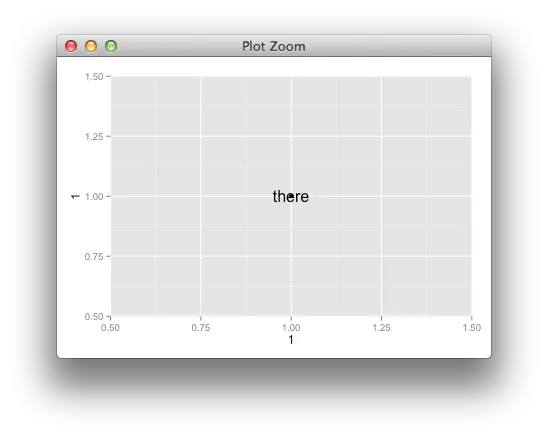
如何将注释放置在中心,而不是角落里?
annotation_custom应该可以工作。 - baptiste