这是我使用饼图作为散点图上的点所做的一个例子。您可以使用相同的概念将条形图放在特定的纬度/经度坐标上地图上。
R::ggplot2::geom_points:如何用饼图替换点?
需要进一步更新。部分使用的代码来自另一个已被删除的答案。如果您通过搜索引擎找到了这个答案,请留下评论,我会重新完善它。
更新:
使用大部分您的答案中的自适应代码,但我不得不更新一些行。
p <- ggmap(Poland) + coord_quickmap(xlim = c(13, 25), ylim = c(48.8, 55.5), expand = F)
这个更改可以得到更好的投射效果,消除了关于重复比例尺的警告。
df.grobs <- df %>%
  do(subplots = ggplot(., aes(1, value, fill = component)) +
       geom_col(position = position_dodge(width = 1),
                alpha = 0.75, colour = "white") +
       geom_text(aes(label = round(value, 1), group = component),
                 position = position_dodge(width = 1),
                 size = 3) +
       theme_void()+ guides(fill = F)) %>%
  mutate(subgrobs = list(annotation_custom(ggplotGrob(subplots),
                                           x = lon-0.5, y = lat-0.5,
                                           xmax = lon+0.5, ymax = lat+0.5)))
在这里,我明确指定了你的geom_col的躲闪宽度,以便将其与geom_text匹配。我使用round(value, 1)来设置标签美学属性,它会自动继承x和y美学属性,这些属性来自于subplots = ggplot(...)调用。我还手动设置了相当小的大小,使标签适合,但是我增加了每个子图的整体边界框大小,从0.35增加到0.5。
df.grobs %>%
{p +
.$subgrobs +
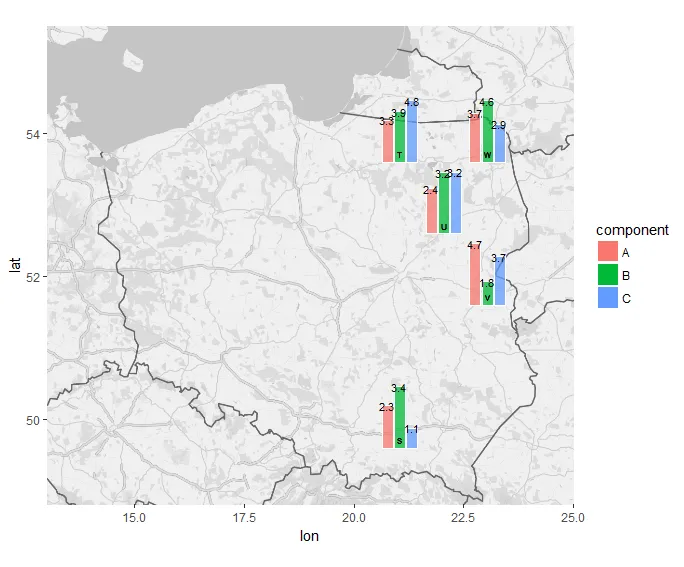
geom_text(data=df, aes(label = name), vjust = 3.5, nudge_x = 0.065, size=2) +
geom_col(data = df,
aes(Inf, Inf, fill = component),
colour = "white")}
我在这里做的唯一更改是为了美学上的“ghost”
geom_col。 当它们被设置为0,0时,它们根本没有绘制,因为那不在x和y限制范围内。 通过使用Inf,Inf,它们被绘制在远处的右上角,足以使它们不可见,但仍然在图例中绘制。