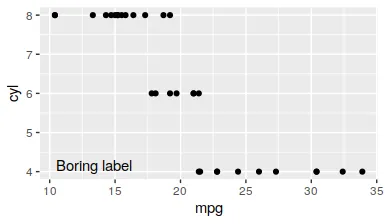
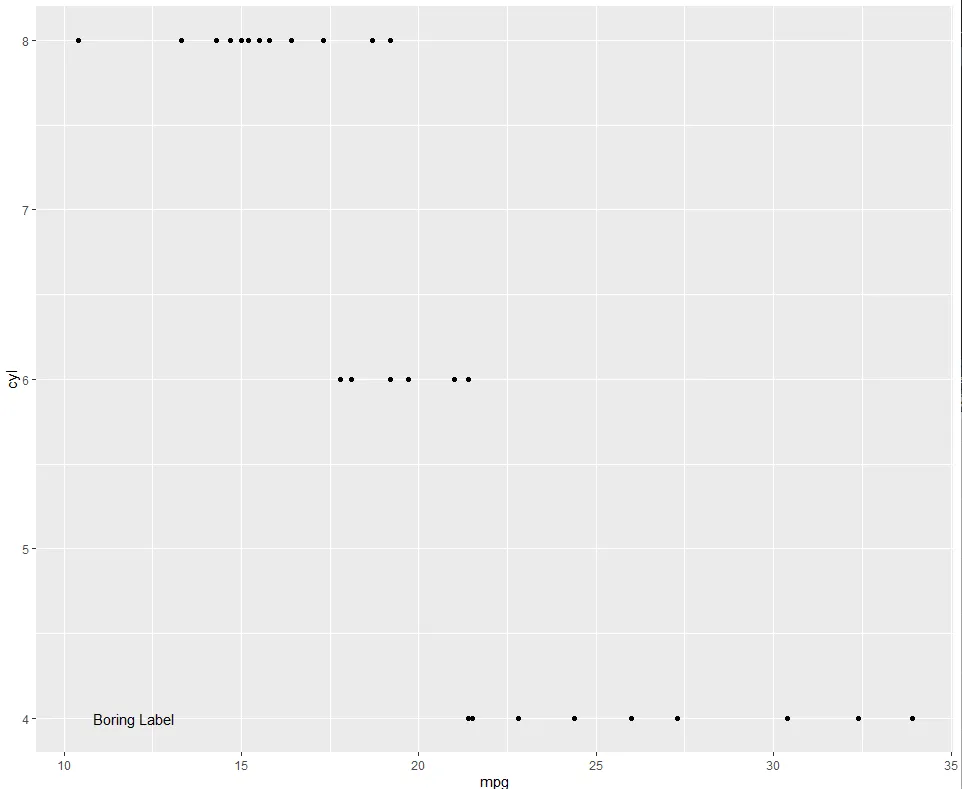
如何在不知道图形准确坐标的情况下,将文本放置在 ggplot2 图形上?

4

我有一个用以下代码生成的图表g:

library(ggplot2)

g = ggplot(mtcars, aes(mpg, cyl)) +
        geom_point()

现在,我想使用annotate(或其他方法)向图中添加文本。我特别希望文本出现在图的左下角。
这样可以:
g + annotate("text", x = 12, y = 4, label = "Boring Label")

enter image description here

然而,这种方法的问题在于我必须知道情节坐标(x = 12,y = 4)才能将文本放置在情节的左下方。我要为许多不同的情节自动化此过程,并且我想在不知道情节的最小和最大坐标的情况下将相同的文本放置在相同的位置(左下角)。例如,像c(0.3,0.1)c(x = 0.3,y = 0.1)(x和y的最小值为0,最大值为1)会非常有帮助。但是使用annotate(“text”,x = 0.3,y = 0.1,label =“无聊的标签”)无法实现。

3个回答

4

您可以使用library(ggpp)来指定以npc单位为单位的文本位置:

g + ggpp::geom_text_npc(aes(npcx = x, npcy = y, label=label), 
                  data = data.frame(x = 0.05, y = 0.05, label='Boring label'))

enter image description here


2
你可以尝试这个方法,通过每个变量的最大值来缩放位置。当然,你可以根据文本所在的位置更改0.95的值。
ggplot(mtcars, aes(mpg, cyl)) +
        geom_point() +
        annotate("text", x = max(mtcars$mpg) * 0.95, y = max(mtcars$cyl) * 0.95, label = "Boring Label")

enter image description here


2
另一种选项是将 x 和 y 坐标设为 Inf,并调整 vjusthjust 来指定左下角的精确位置:
library(ggplot2)
ggplot(mtcars, aes(mpg, cyl)) +
  geom_point() + 
  annotate("text", x = -Inf, y = -Inf, label = "Boring Label", vjust = -1, hjust = 0)

通过 reprex package (v2.0.1) 创建于2022年8月13日


网页内容由stack overflow 提供, 点击上面的
可以查看英文原文,
原文链接