在ggplot2上叠加ggmap和geom_polygon(shape file)

5

我有一个shape文件,想要在谷歌地图上使用ggplot将其呈现出来,但是使用geom_polygon(ggplot2)进行呈现时会显示出不合理的线条。

我的代码:

 ######## the shape file ftp://geoftp.ibge.gov.br/organizacao_do_territorio/malhas_territoriais/malhas_municipais/municipio_2015/Brasil/BR/
  download.file("ftp://geoftp.ibge.gov.br/organizacao_do_territorio/malhas_territoriais/malhas_municipais/municipio_2015/Brasil/BR/br_municipios.zip",temp)

data <- unz(temp, "BRMUE250GC_SIR.shp")

 data.shape<-st_read(data)


  ####### the map from ggmap
  mapa_edital_guarulhos <- get_map(location="GUARULHOS-SP",zoom=11,color = "bw",
                                   maptype = "roadmap") 


 mapa_edital_guarulhos_01<- ggmap(mapa_edital_guarulhos)

 ########## plotting with ggplot

 mapa_edital_guarulhos1 <- mapa_edital_guarulhos_01 + 
 geom_polygon(aes(x=long,y=lat, group=group), data=shape.sp, 
 color='black',alpha=0)

结果为:

结果:

enter image description here

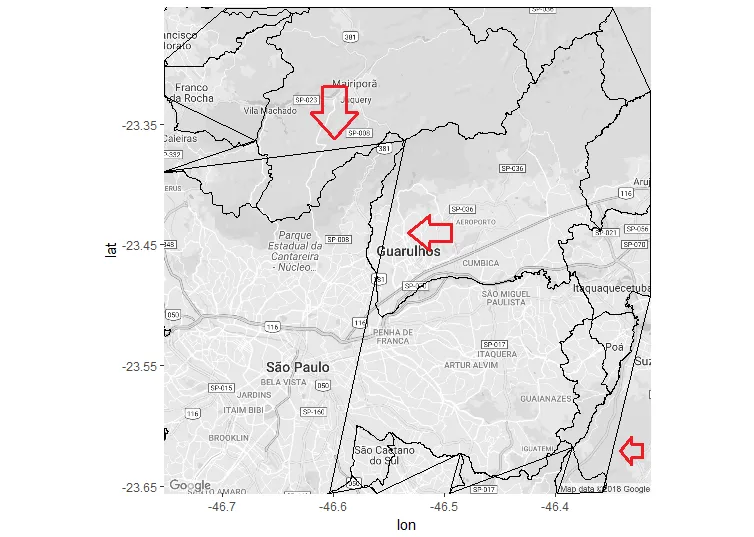
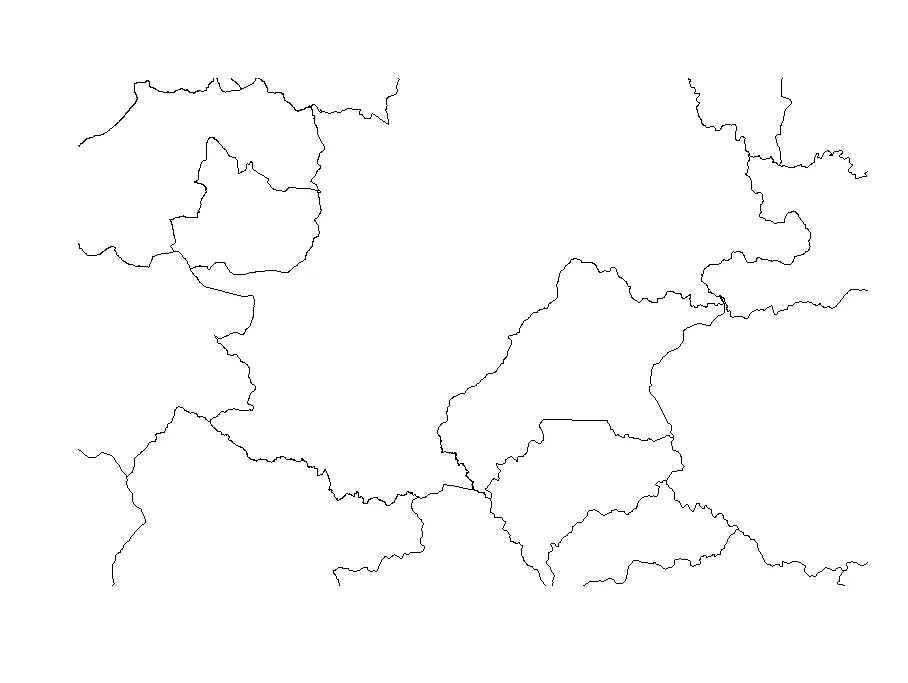
箭头指示的是在我的绘图中没有意义的线条,仅绘制相同间隔的形状:

plot(shape.sp,xlim=c(-47.25,-46.95),ylim=c(-23.1,-22.7)) 

在这里输入图片描述

我的代码有什么问题?谢谢。


1
列出该shapefile的来源(不列出内部路径)。尝试仅查看shapefile,而不包括背景,以查看线条是否保留。如果是这样,请移除背景。隔离问题。 - LucasMation
1
另外,在QGIS上打开同一个文件,检查是否在那里显示相同的线条。 - LucasMation
1个回答

4

建议使用geom_sf而不是geom_polygon

首先安装ggplot2的开发版

devtools::install_github('tidyverse/ggplot2')

# read using sf instead of readOGR
library(sf)
# something like:
  data.shape <- st_read("www./BRMUE250GC_SIR.shp")

  ####### the map from ggmap
  mapa_edital_guarulhos <- get_map(location="GUARULHOS-SP",zoom=11,color = "bw",
                                   maptype = "roadmap") 


 mapa_edital_guarulhos_01<- ggmap(mapa_edital_guarulhos)

 ########## plotting with ggplot

 mapa_edital_guarulhos1 <- mapa_edital_guarulhos_01 + 
 geom_sf(data = data.shape, color = 'black', alpha=0)

没有数据集,这个很难测试。但如果可以,请告诉我!我之前见过这种方法解决你遇到的问题。


嘿@sebalgarno,感谢您的帮助。我编辑了帖子以便复现。我按照步骤操作,但是在ggplot2包中找不到函数geom_sf()。谢谢。 - João Machado
1
如答案所述,您必须使用devtools::install_github('tidyverse/ggplot2')下载ggplot2的开发版本。下载后,请尝试重新启动R会话并重新加载库。 - sebdalgarno
我遇到了同样的问题,另一个解决方案是使用geom_map()而不是geom_sf()。 - Santiago I. Hurtado

网页内容由stack overflow 提供, 点击上面的
可以查看英文原文,
原文链接