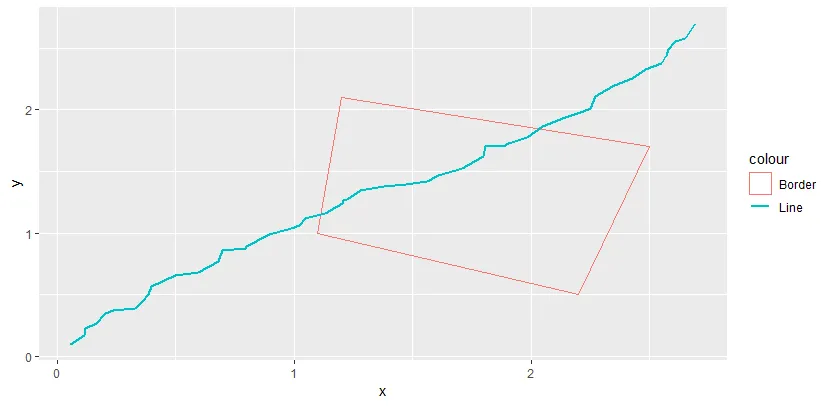
ggplot2:如何在图例键中分离geom_polygon和geom_line?

9
我想要做到以下两点:
  • 去掉geom_polygon图例键内的线条
  • 去掉geom_line图例键的边框
期望的输出为:

enter image description here

迄今为止,我的尝试失败了。非常感谢您提供的帮助!
library(ggplot2)

set.seed(1337)

dat <- structure(list(id = structure(c(2L, 2L, 2L, 2L), 
                                    .Label = c("1.1", "1.2", "1.3", "2.1", "2.2", "2.3"), 
                                    class = "factor"), 
                     value = c(3.1, 3.1, 3.1, 3.1),
                     x = c(2.2, 1.1, 1.2, 2.5), 
                     y = c(0.5, 1, 2.1, 1.7)), 
                class = "data.frame", 
                row.names = c(NA, -4L))

line <- data.frame(
  x = cumsum(runif(50, max = 0.1)),
  y = cumsum(runif(50, max = 0.1))
)

ggplot(dat, aes(x = x, y = y)) +
  geom_polygon(aes(color = "Border", group = id), fill = NA) +
  geom_line(data = line, aes(colour = "Line"), size = 1) +
  theme(legend.background = element_rect(fill = "transparent"), 
        legend.box.background = element_rect(fill = "transparent", colour = NA),
        legend.key = element_rect(fill = "transparent"))


2
思路:在几何图形内定义你的审美,使用scale_fill来设置颜色。 - M--
@Masoud:你能把它发布为答案吗?谢谢。 - IloveCatRPython
2
这是我之前使用的一种解决方法;让我看看我能为你做什么。 - M--
2个回答

7
这是个好问题,我见过几个相关的技巧。这很棘手,因为两个geoms都映射到颜色,并且每个美学只能获得一个图例。以下是一种方式:实际上制作不同的图例,每个使用不同的美学,并将它们伪装成一个图例。
对于线条,我将“Line”映射到linetype而不是颜色,并设置了硬编码颜色。然后我设置了linetype规模以给出1,即实线。在guides中,我去掉了linetype的标题并设置顺序,使颜色首先出现,然后是linetype。现在有两个图例,但是下面的那个没有标题。要使它们看起来像一个连续的图例,请在图例之间设置负间距。当然,如果您有另一个图例,这样做效果可能不太好,那么您需要一些不同的技巧。
library(ggplot2)

ggplot(dat, aes(x = x, y = y)) +
  geom_polygon(aes(color = "Border", group = id), fill = NA) +
  geom_line(aes(linetype = "Line"), data = line, color = "blue") +
  scale_linetype_manual(values = 1) +
  guides(linetype = guide_legend(title = NULL, order = 2), color = guide_legend(order = 1)) +
  theme(legend.background = element_rect(fill = "transparent"), 
        legend.box.background = element_rect(fill = "transparent", colour = NA),
        legend.key = element_rect(fill = "transparent"), 
        legend.spacing = unit(-1, "lines") )

请注意,您可以使用多种不同的美学组合来实现此目的,而不仅仅是颜色 + 线型。相反,您可以将其映射到多边形的填充上,然后将其 alpha 设置为 0,这样它就会创建一个填充图例,但实际上并不出现填充。

3

它们必须属于同一个图例吗?如果不是,那么您可以为多边形使用“fill”美学,为线条使用“colour”美学:

ggplot(dat, aes(x = x, y = y)) +
    geom_polygon(aes(fill = "Border", group = id), colour="black") +
    geom_line(data = line, aes(colour = "Line"), size = 1) +
    scale_fill_manual(values=c(NA))

非常感谢。如果可能的话,我希望它们在同一个图例中。 - IloveCatRPython
1
@IloveCatRPython 好的,这就是我想表达的意思。你想要的有点棘手,因为边界(多边形)是相互连接的几条线。如果它是点,那么我们可以在图例中为点的图例定义线条的形状,但现在,我很难想出满足你需求的解决方案。 - M--

网页内容由stack overflow 提供, 点击上面的
可以查看英文原文,
原文链接