ggplot2 - 合并geom_point和geom_line的图例

4
我有一组数据集,想要将其中一个变量绘制成点,其他变量则以不同的线型绘制为线条(每个变量用不同的颜色表示)。
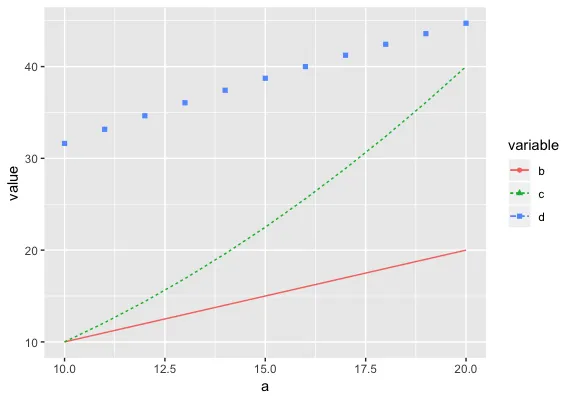
 a <- c(10:20)
 df <- data.frame(a=a,b=a,c=a*a/10,d=10*sqrt(a))
 df_melt <- reshape2::melt(df,id.vars='a')

 ggplot(df_melt, aes(x=a,y=value,colour=variable,linetype=variable,shape=variable))+
           geom_line(data=subset(df_melt,variable == "b"))+
           geom_line(data=subset(df_melt,variable == "c"))+
           geom_point(data=subset(df_melt,variable == "d"))

这将生成所需的绘图:

enter image description here

然而,图例现在显示了所有三个变量的线型和形状,尽管不是所有变量都实际显示它们。
我该如何相应地删除线型或形状,以使图例与绘图显示一致?

你可能想使用guides()函数:guides文档 - Krzysztof Nowicki
1个回答

7
通常情况下,如果您发现自己需要添加多个具有不同子集的 geom_line()geom_point() 图层,则通常存在一种更好的方式,涉及对变量进行直接操作。在这里,我通过在应该缺失的点或线中添加NA值(在 scale_linetype_manual()scale_shape_manual() 中)来实现。 (使用的形状/线型与上面使用的不完全相同,但很容易调整。)
ggplot(df_melt, aes(x=a,y=value,colour=variable,
                    linetype=variable,shape=variable))+
    geom_point()+
    geom_line()+
    scale_linetype_manual(values=c(1,2,NA))+
    scale_shape_manual(values=c(NA,NA,2))

现在需要字符串值,例如 scale_linetype_manual(values=c("solid","dashed",NA)) - undefined
是吗?我正在使用ggplot2 3.4.2版本,它似乎正常工作;最近有更新吗? - undefined
R版本4.2.3ggplot2_3.4.2中,我遇到了错误:_Error in grid.Call.graphics(C_lines, x$x, x$y, index, x$arrow) : invalid line type: must be length 2, 4, 6 or 8_。 - undefined
哎呀,你说得对。我之前不知道自己在做什么。现在我明白了。我可能会发布一个 ggplot 的问题,因为在 ggplot 的 NEWS 文件 中没有明确提到线型的内容。 - undefined

网页内容由stack overflow 提供, 点击上面的
可以查看英文原文,
原文链接