我有一个数据集,其中geom_line和geom_point存在显著重叠,我希望对它们进行微调。在过去,这个解决方案(如何同时微调geom_line和geom_point?)对我很有用,但出于某种原因,我无法在此数据集上使用它。
以下是我的数据:
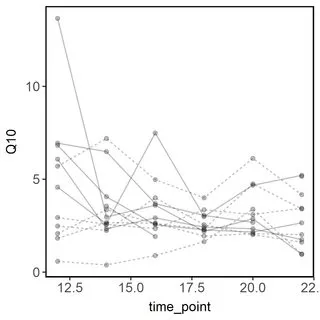
看起来是这样的:
以下是我的数据:
dput(test)
structure(list(individual_code = structure(c(1L, 1L, 1L, 1L,
1L, 1L, 2L, 2L, 2L, 2L, 2L, 2L, 3L, 3L, 3L, 3L, 3L, 3L, 4L, 4L,
4L, 4L, 4L, 4L, 5L, 5L, 5L, 5L, 5L, 5L, 6L, 6L, 6L, 6L, 6L, 6L,
7L, 7L, 7L, 7L, 7L, 7L, 8L, 8L, 8L, 8L, 8L, 8L, 9L, 9L, 9L, 9L,
9L, 9L, 10L, 10L, 10L, 10L, 10L, 11L, 11L, 11L, 11L, 11L, 11L,
12L, 12L, 12L, 12L, 12L, 12L), .Label = c("852", "858", "860",
"876", "879", "881", "883", "893", "908", "927", "940", "945"
), class = "factor"), storage_temp = structure(c(1L, 1L, 1L,
1L, 1L, 1L, 1L, 1L, 1L, 1L, 1L, 1L, 2L, 2L, 2L, 2L, 2L, 2L, 2L,
2L, 2L, 2L, 2L, 2L, 2L, 2L, 2L, 2L, 2L, 2L, 2L, 2L, 2L, 2L, 2L,
2L, 1L, 1L, 1L, 1L, 1L, 1L, 2L, 2L, 2L, 2L, 2L, 2L, 1L, 1L, 1L,
1L, 1L, 1L, 1L, 1L, 1L, 1L, 1L, 2L, 2L, 2L, 2L, 2L, 2L, 1L, 1L,
1L, 1L, 1L, 1L), .Label = c("23", "7"), class = "factor"), time_point = c(12,
14, 16, 18, 20, 22, 12, 14, 16, 18, 20, 22, 12, 14, 16, 18, 20,
22, 12, 14, 16, 18, 20, 22, 12, 14, 16, 18, 20, 22, 12, 14, 16,
18, 20, 22, 12, 14, 16, 18, 20, 22, 12, 14, 16, 18, 20, 22, 12,
14, 16, 18, 20, 22, 14, 16, 18, 20, 22, 12, 14, 16, 18, 20, 22,
12, 14, 16, 18, 20, 22), Q10 = c(13.6570247933884, 2.96984924623116,
3.60106382978723, 2.18942731277533, 2.8705035971223, 0.966304347826087,
4.57042253521127, 2.59362549800797, 7.48427672955975, 2.98943661971831,
4.6779303062302, 5.2092050209205, 0.583657587548638, 0.38768115942029,
0.891025641025641, 1.63664596273292, 3.39024390243902, 0.964705882352941,
2.07727272727273, 3.35548172757475, 2.61574074074074, 2.32717678100264,
4.74789915966386, 3.40068493150685, 2.48206599713056, 2.24120603015075,
4.00229357798165, 2.55284552845528, 2.01652892561983, 1.6096256684492,
2.93939393939394, 2.57309941520468, 2.34586466165414, 3.35555555555556,
3.10169491525424, 3.44052863436123, 6.94339622641509, 6.48412698412698,
3.68548387096774, 3.05286343612335, 2.67857142857143, NA, 1.82513661202186,
2.66666666666667, 2.63414634146341, 1.93916349809886, 2.07174887892377,
2.01941747572815, 6.82882882882883, 4.05882352941176, 2.54929577464789,
2.27272727272727, 2.15730337078652, 2.65060240963855, 3.5531914893617,
1.91964285714286, NA, NA, 5.15566625155666, 5.70212765957447,
7.19266055045872, 4.97814207650273, 4, 6.12162162162162, 4.1701030927835,
6.078125, 2.33333333333333, 2.91836734693878, 2.42307692307692,
2.33152173913043, 1.75)), row.names = c(NA, -71L), class = "data.frame")
我的工作代码有太多的重叠部分:
library(ggplot2)

ggplot(data = Q10_summary, aes(
      x = time_point, y = Q10, color = storage_temp
    )) +
    Alex_Theme +
    geom_point(
      data = therm_sen_final,
      aes(time_point, Q10, group = storage_temp),
      alpha = 0.25,
      color = 'black',
      #position = position_jitter(width = 0.25)
    ) +
    geom_line(
      data = therm_sen_final,
      aes(group = individual_code, linetype = storage_temp),
      color = 'black',
      alpha = 0.25,
      #position = position_jitter(width = 0.25)
    )
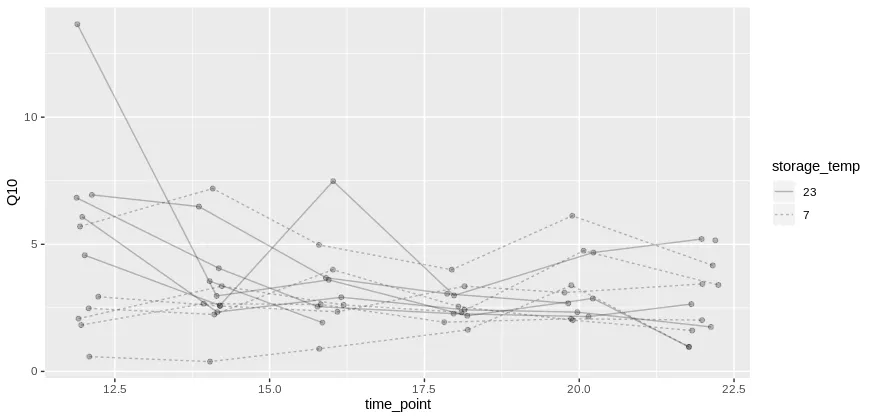
看起来是这样的: