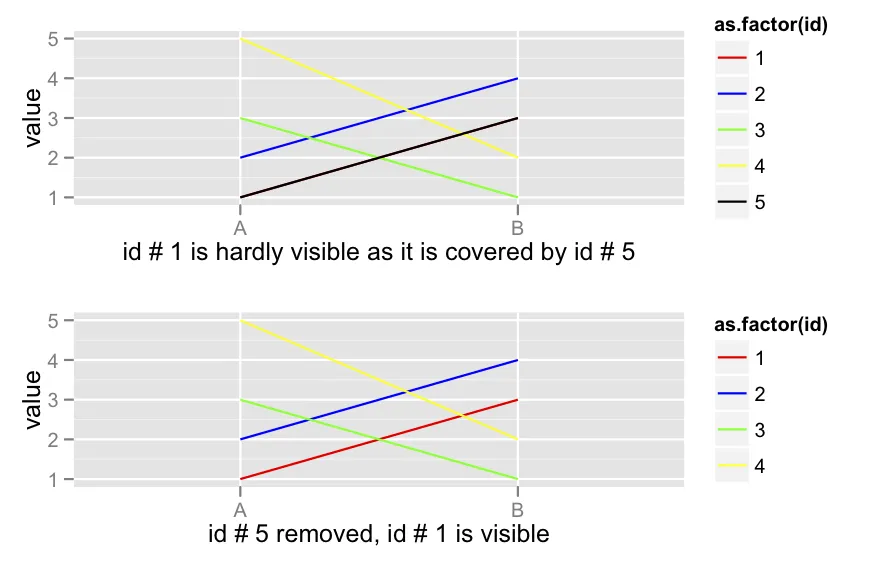
有没有办法在geom_line()中抖动线条?我知道这有点违背了这个图的目的,但如果您有一个只有几条线并希望它们都显示的图,这可能很方便。也许还有其他解决这个可见性问题的方法。
请参见下面的代码,
A  <- c(1,2,3,5,1)
B  <- c(3,4,1,2,3)
id <- 1:5
df <- data.frame(id, A, B)


# install.packages(reshape2)
require(reshape2) # for melt
dfm <- melt(df, id=c("id"))

# install.packages(ggplot2)
require(ggplot2)
p1 <- ggplot(data = dfm, aes(x = variable, y = value, group = id,
color= as.factor(id))) + geom_line() + labs(x = "id # 1 is hardly
visible as it is covered by id # 5") + scale_colour_manual(values =
c('red','blue', 'green', 'yellow', 'black'))


p2 <- ggplot(subset(dfm, id != 5), aes(x = variable, y = value,
group = id, color= as.factor(id))) + geom_line() + labs(x = "id #
5 removed, id # 1 is visible") + scale_colour_manual(values =
c('red','blue', 'green', 'yellow', 'black'))

# install.packages(RODBC)
require(gridExtra)

grid.arrange(p1, p2)