我有两个类似于这样的数据框:
date <- c("2014-07-06", "2014-07-06","2014-07-06","2014-07-07", "2014-07-07","2014-07-07","2014-07-08","2014-07-08","2014-07-08")
TIME <- c("01:01:01", "10:02:02", "18:03:03","01:01:01", "10:02:02", "18:03:03","01:01:01", "10:02:02", "18:03:03")
depth <- c(12, 23, 4, 15, 22, 34, 22, 12, 5)
temp <- c(14, 10, 16, 13, 10, 9, 10, 14, 16)
depth.temp <- data.frame(date, TIME, depth, temp)
depth.temp$asDate<-as.Date(depth.temp$date)

date <- c("2014-07-06", "2014-07-07","2014-07-08")
meandepth <- c(13, 16, 9)
cv <- c(25, 9, 20)
depth.cv <- data.frame(date, meandepth, cv)
depth.cv$asDate<-as.Date(depth.cv$date)
从第一个创建的图表开始,我已经创建了以下图表:
library(ggplot2)
p1 <- qplot(asDate, depth, data=depth.temp, colour=temp, size = I(5), alpha = I(0.3))+ scale_y_reverse()
p1 + scale_colour_gradientn(colours = rev(rainbow(12)))
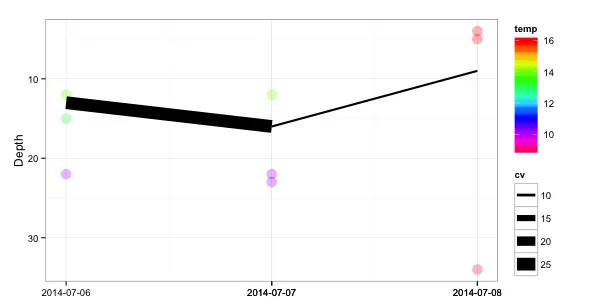
从第二个图表可以看出:
p2 <- ggplot(depth.cv, aes(x=asDate, y=meandepth))+ scale_y_reverse()
p2 + geom_line(aes(size = cv))
我希望将两个图表合并为一个,其中点在后面,线在前面,有什么建议?请注意,这些点和线不是来自同一个数据框架。