我有一个数据框 image.rgb,其中我加载了每个图像坐标的 r、g、b 值(使用 jpeg 和 reshape 软件包)。它现在看起来像这样:
> head(image.rgb)
   y x         r         g         b
1 -1 1 0.1372549 0.1254902 0.1529412
2 -2 1 0.1372549 0.1176471 0.1411765
3 -3 1 0.1294118 0.1137255 0.1176471
4 -4 1 0.1254902 0.1254902 0.1254902
5 -5 1 0.1254902 0.1176471 0.1294118
6 -6 1 0.1725490 0.1372549 0.1176471
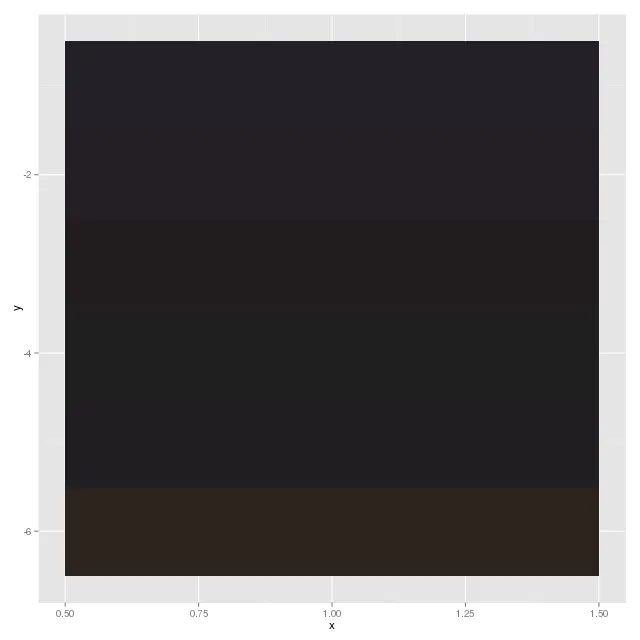
现在我想使用ggplot2绘制这个“图像”。 我可以通过以下方式绘制一个特定的“通道”(红色或绿色或蓝色):
ggplot(data=image.rgb, aes(
            x=x, y=y,
            col=g) #green for example
       ) + geom_point()
...默认的ggplot2颜色比例尺
有没有一种方式可以指定从我指定的列中获取精确的rgb值?
使用base包中的plot函数,我可以使用
with(image.rgb, plot(x, y, col = rgb(r,g,b), asp = 1, pch = "."))
但我希望能够使用ggplot2来实现这一点
ggplot(data=image.rgb, aes(x=x, y=y, col=rgb(r,g,b))) + geom_point()有什么问题吗?在这里似乎可以工作... - juba