如何从图像中提取RGB并仅绘制RG作为图表?将R用作X轴,G用作Y轴。

3
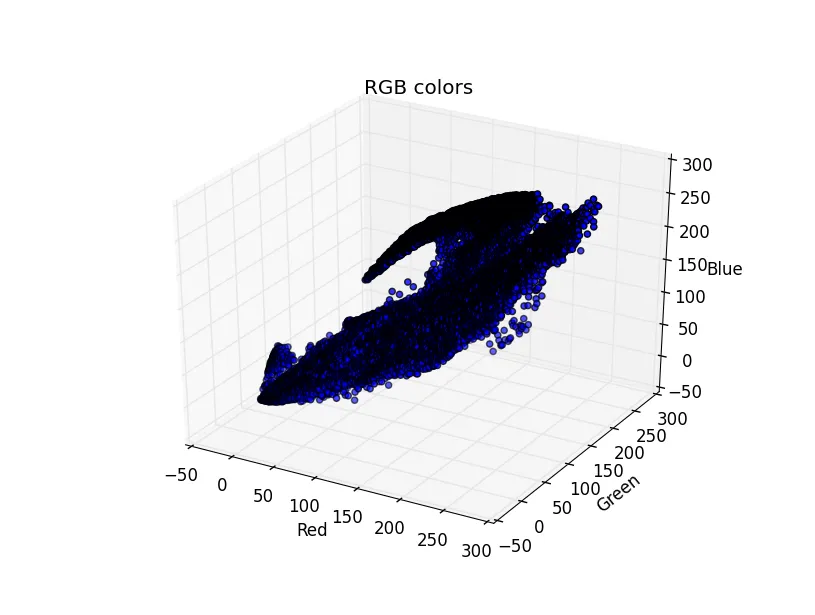
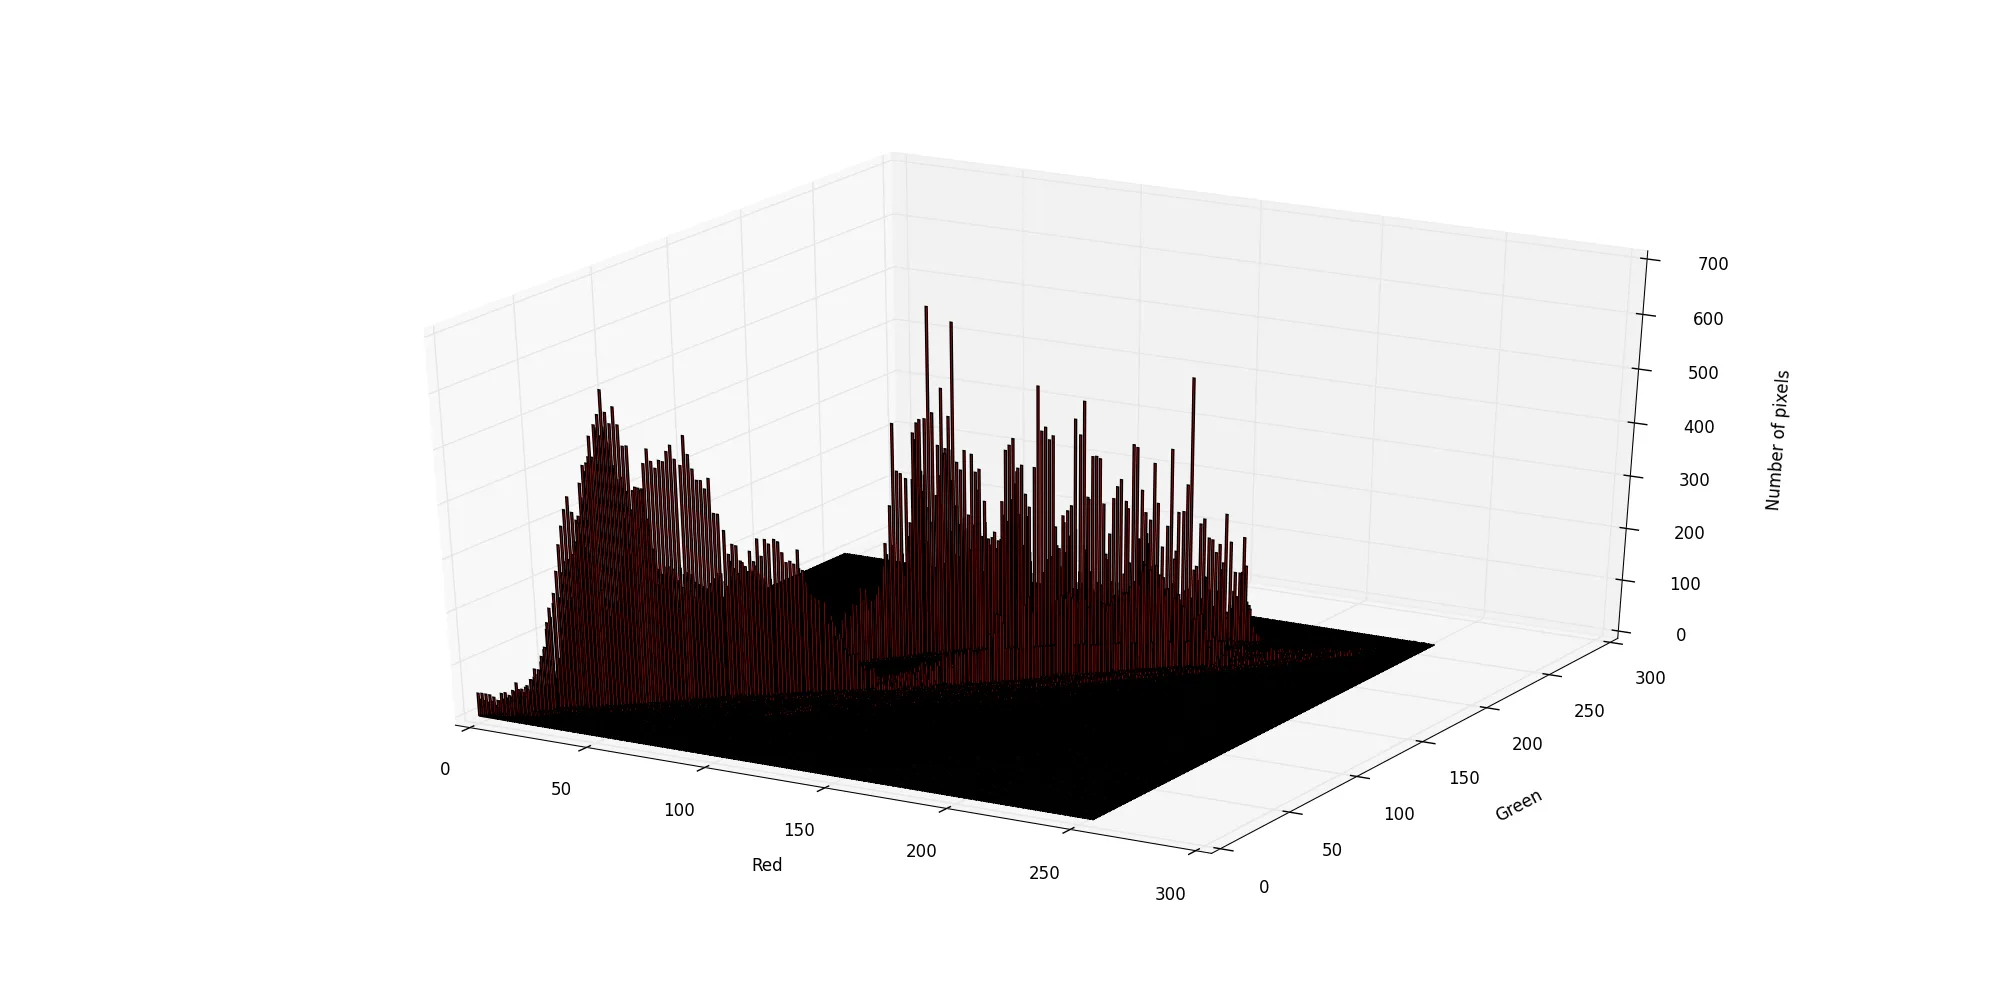
我希望能够从一张图片中提取RGB分量,并使用matplotlib绘制3D RGB直方图。但我不知道如何实现。
以下是我的当前代码:
import cv2
import numpy as np
from scipy import ndimage
from matplotlib import pyplot as plt

img_file = 'Paw03.png'
img = cv2.imread(img_file, cv2.IMREAD_COLOR)           # rgb
#hsv_img = cv2.cvtColor(img,cv2.COLOR_BGR2HSV)         # hsv

rows, cols, ch = img.shape

for x in range(rows):
    for y in range(cols):
        if (img[x, y, 1] == img[0, 255, 0]):
            break;
        else:
            print "Pixel:", x, y
            print  "R:", R 
            print  "G:", g
            print  "B:", b
            print "\n"

plt.plot(r, 'ro', b, 'b^')
plt.xlim([0, 255])
plt.xlabel('Pixel')
plt.ylabel('Quantity')
plt.title('Distribution of RGB in the image')
plt.show()

但是它不起作用!

因此,我尝试了三个for:

import cv2
import numpy as np
from scipy import ndimage
from matplotlib import pyplot as plt

img_file = 'Paw03.png'
img = cv2.imread(img_file, cv2.IMREAD_COLOR)           # rgb
#hsv_img = cv2.cvtColor(img, cv2.COLOR_BGR2HSV)        # hsv

rows, cols, ch = img.shape

for x in range(rows):
    for y in range(cols):
        for z in range(ch)
            if (img[x, y, z] == img[0, 255, 0]):
                break;
            else:
                print "Pixel:", x, y
                print  "R:", R 
                print  "G:", g
                print  "B:", b
                print "\n"

plt.plot(r, 'ro', b, 'b^')
plt.xlim([0, 255])
plt.xlabel('Pixel')
plt.ylabel('Quantity')
plt.title('Distribution of RGB in the image')
plt.show()

它只适用于循环中的打印,并且每个像素需要保存三次,对于matplotlib无效。

有人可以帮我吗?

2个回答

1
以下代码片段显示了图像RGB颜色的3D散点图:
import numpy as np
import matplotlib.image as mpimg
from matplotlib import pyplot as plt
from mpl_toolkits.mplot3d import Axes3D

img = mpimg.imread('Paw03.png')
pixels = img.shape[0]*img.shape[1]
channels = 3
data = np.reshape(img[:, :, :channels], (pixels, channels))

histo_rgb, _ = np.histogramdd(data, bins=256)
r, g, b = np.nonzero(histo_rgb)

fig = plt.figure()
ax = fig.add_subplot(111, projection='3d')
ax.scatter3D(r, g, b)
ax.set_xlabel('Red')
ax.set_ylabel('Green')
ax.set_zlabel('Blue')
plt.title('RGB colors')
plt.show()

这是运行以上代码后得到的结果(显然取决于所使用的特定图像):图像RGB颜色的3D散点图 如果你想在三维中可视化红色和绿色通道的二维直方图,那么你可能会发现这段代码很有用:
import numpy as np
import matplotlib.image as mpimg
from matplotlib import pyplot as plt
from mpl_toolkits.mplot3d import Axes3D

img = mpimg.imread('Paw03.png')
pixels = img.shape[0]*img.shape[1]
channels = 3
data = np.reshape(img[:, :, :channels], (pixels, channels))

histo_rgb, _ = np.histogramdd(data, bins=256)
histo_rg = np.sum(histo_rgb, 2)
levels = np.arange(256)

fig = plt.figure()
ax = fig.add_subplot(111, projection='3d')
for g in levels:
    ax.bar(levels, histo_rg[:, g], zs=g, zdir='y', color='r')
ax.set_xlabel('Red')
ax.set_ylabel('Green')
ax.set_zlabel('Number of pixels')
plt.show()

以下是相应的输出:

图像的联合RG直方图的3D表示


我尝试过,它返回给我一个像直方图一样的输出。但是我想要像这张图片一样打印:http://machinethatsees.blogspot.com.br/2012/07/how-to-plot-color-in-3d-rgb-color-space.html 但是在二维平面上。因此,R为X轴,G为Y轴。你明白我的意思吗?如果你能帮忙,我的电子邮件是:lucas.roberto.lrc@gmail.com。我们可以在那里更容易地沟通。谢谢帮助! - Lucas

0

我看不到你的代码示例中设置 R、g 和 b 值的地方。另外,plot.plot(r,'ro',b,'b^') 看起来不是在绘制系列而是单个点。


我正在尝试使用matplotlib将R和G分布显示为图形。RGB值来自于图像的numpy数组。 - Lucas

网页内容由stack overflow 提供, 点击上面的
可以查看英文原文,
原文链接