在`ggplot2`图表注释中显示`shape`值

3
我想在绘图注释中显示形状值(`geom_point`函数的`shape`参数),比如,在下面的例子中,我只是写了“点的形状”,但实际上我想要显示形状本身。这只是我想做的更复杂的事情的一个简单示例。是否有任何方法可以实现这个目标?
library(ggplot2)

ggplot(mtcars, aes(mpg , wt)) + geom_point(shape = 7) +
  labs(title = "'point shape' represents data point")

2020年1月30日由reprex package (v0.3.0.9001)创建
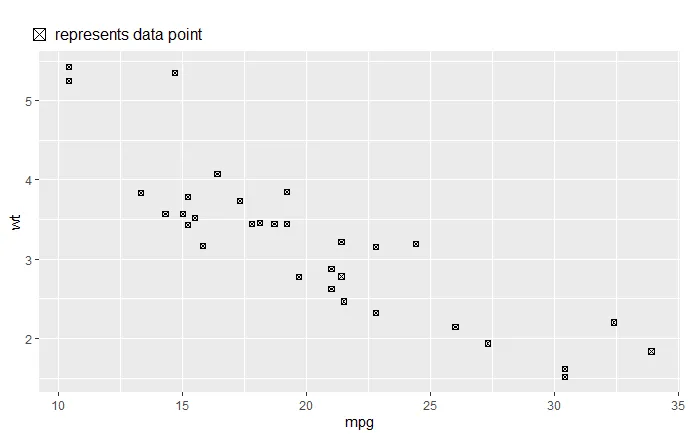

不确定我是否理解您的意思。您是指类似于 ggplot(mtcars,aes(mpg,wt)) + geom_text(aes(label=cyl)) 的代码吗?其中您显示 cyl 的值? - StupidWolf
1
一种可能的方法是添加类似于 annotate("point", x, y, shape = 7) 的内容,然后再加上另一个 annotate("text", x, y, label = "represents...", hjust = 0)。其中 xy 是您希望文本/符号出现的坐标(如果需要,也可以在图外)。 - Ben
@Ben:你能把这个变成一个答案以便投票吗? - Clem Snide
@ClemSnide 根据评论添加了答案。希望这对您有所帮助。 - Ben
4个回答

3

您可以将标题创建为自定义注释,这可以通过将点和文本作为图形对象(“grobs”)粘合在一起来完成。以下是一个小函数,可以实现此操作,同时允许您设置点的形状和颜色以及标题文本。

library(grid)

make_title <- function(point_type = 7, label = "represents data point", col = "black")
{
  Point <- grid::pointsGrob(x = 0.0 , y = 1.05, pch = point_type, gp = gpar(col = col))
  Text <-  grid::textGrob(x = 0.025, y = 1.055, just = "left", label)
  Title <- grid::grobTree(Point, Text)
}

现在你只需要将此作为自定义注释添加到您的图表中。您需要关闭裁剪以允许绘制图表区域之外,并添加一个带有换行符的空标题,以便为新的图表标题留出足够的空间:
library(ggplot2)

ggplot(mtcars, aes(mpg , wt))     + 
  labs(title = "\n ")             +
  geom_point(shape = 7)           +
  annotation_custom(make_title()) + 
  coord_cartesian(clip = "off")

在此输入图像描述

或者如果您需要更改它:

ggplot(mtcars, aes(mpg , wt)) + 
  labs(title = "\n ") +
  geom_point(shape = 3, colour = "red")           +
  annotation_custom(make_title(3, "Different plot with red point", "red")) + 
  coord_cartesian(clip = "off")

enter image description here


2

我认为最好的方法是使用形状编号,并使用键值对列表将其与相应的“点形状”链接起来。

以下是R中所有25个基本形状的shape_label_key,您可以使用ggpubr :: show_point_shapes()查看。

shape_label_key <- list(
    key = c(0:24),
    value = c(
        "square", "circle", "triangle point up", "plus", "cross", "diamond", "triangle point down",
        "square cross", "star", "diamond plus", "circle plus", "triangles up and down", "square plus",
        "circle cross", "square and triangle down", "filled square", "filled circle", "filled triangle point-up",
        "filled diamond", "solid circle", "bullet (smaller circle)", "filled circle blue", "filled square blue",
        "filled diamond blue", "filled triangle point-up blue", "filled triangle point down blue"
    )
)
ggplot(mtcars, aes(mpg , wt)) + geom_point(shape = 7) +
  labs(title = paste0("'", shape_label_key$value[shape_label_key$key == 7], "' represents data point"))

希望这能帮到您!

在此输入图片描述


为了简化代码并编写更好的代码,您必须将shape_value作为变量传递,而不是两次都传递7! - Vedha Viyash
1
将您的图形保存到变量p1中,然后使用此代码:p1$layers[[1]]$aes_params$shape获取变量,这样您就不必再次输入它。这假定geom_point()始终是第一层。 - Brandon Bertelsen

2

如评论中所建议的,这是一种快速而简单的方法来获取包含形状的标题。

使用annotate显示形状/点,然后使用第二个annotate来显示形状后面的文本。

coord_cartesian还设置了y轴限制,并且将clip参数设置为“off”,允许在绘图区域之外放置文本。

library(ggplot2)

ggplot(mtcars, aes(mpg , wt)) + 
  geom_point(shape = 7) +
  labs(title = "") +
  annotate("point", 0, 6.5, shape = 7) +
  annotate("text", .5, 6.5, label = "represents data point", hjust = 0) +
  coord_cartesian(ylim = c(0, 6), clip = "off")

情节

plot with shape and text in title


1
我更喜欢这样,因为它更少地“侵入式”,并且仍然可以完全自定义。 - Clem Snide

0

你可以在 aes() 中添加 color

ggplot(data=mtcars, mapping = aes(x = mpg, y = wt, color=cyl), show.legend = TRUE) + 
geom_point(shape=7) + 
theme(legend.position = "top")

我不想显示图例。我想在注释内部显示点形状。 - Indrajeet Patil
抱歉,误解了问题。 - cmirian

网页内容由stack overflow 提供, 点击上面的
可以查看英文原文,
原文链接