我得到了这个图
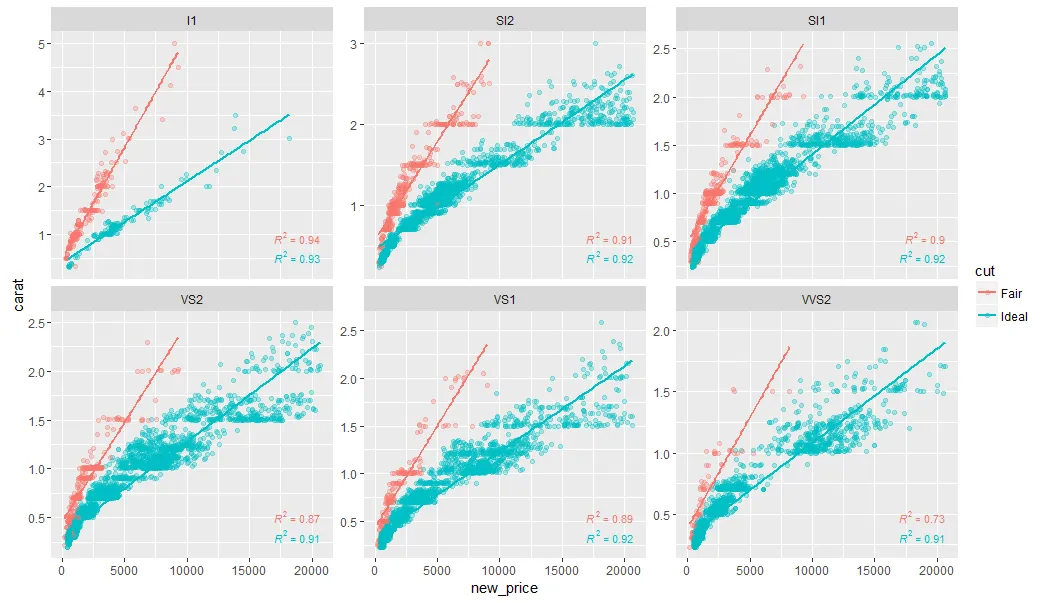
使用以下代码
library(dplyr)
library(ggplot2)
library(ggpmisc)

df <- diamonds %>%
  dplyr::filter(cut%in%c("Fair","Ideal")) %>%
  dplyr::filter(clarity%in%c("I1" ,  "SI2" , "SI1" , "VS2" , "VS1",  "VVS2")) %>%
  dplyr::mutate(new_price = ifelse(cut == "Fair",
                                   price* 0.5,
                                   price * 1.1))

formula <- y ~ x
ggplot(df, aes(x= new_price, y= carat, color = cut)) +
  geom_point(alpha = 0.3) +
  facet_wrap(~clarity, scales = "free_y") +
  geom_smooth(method = "lm", formula = formula, se = F) +
  stat_poly_eq(aes(label = paste(..rr.label..)),
               label.x.npc = "right", label.y.npc = 0.15,
               formula = formula, parse = TRUE, size = 3)
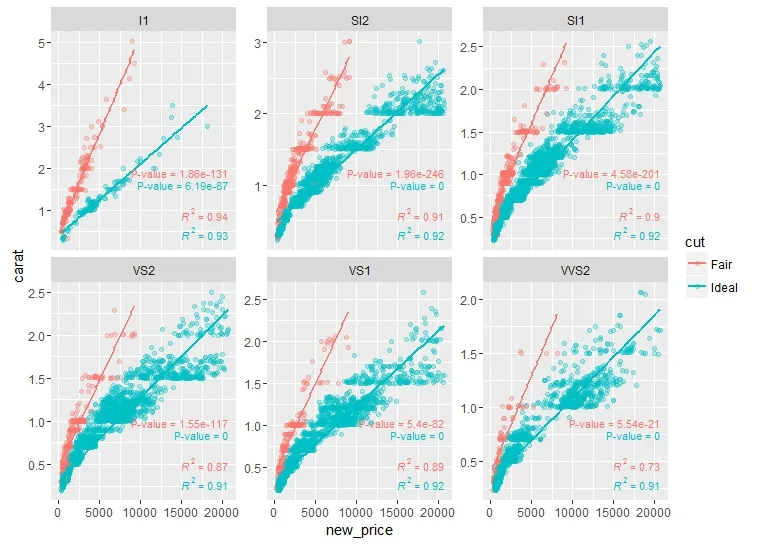
除了R2之外,我还想在分面上添加p值。我可以通过先运行回归得出p值,然后使用geom_text()添加这些p值,类似于这个问题的答案。
有没有更快或更自动化的方法来做到这一点?例如与添加R2值的方式类似。
更新
我所说的p值是斜率p值。当p < 0.005时,趋势被认为是高度统计显著的。
summarize()。 - Manuel Rggpmisc包的作者在ggplot2:在图表上添加回归线方程和R2问题的答案以获取更多详细信息,或联系作者。 - Uwestat_fit_glance吗?来源:https://cran.r-project.org/web/packages/ggpmisc/vignettes/examples.html - bVa