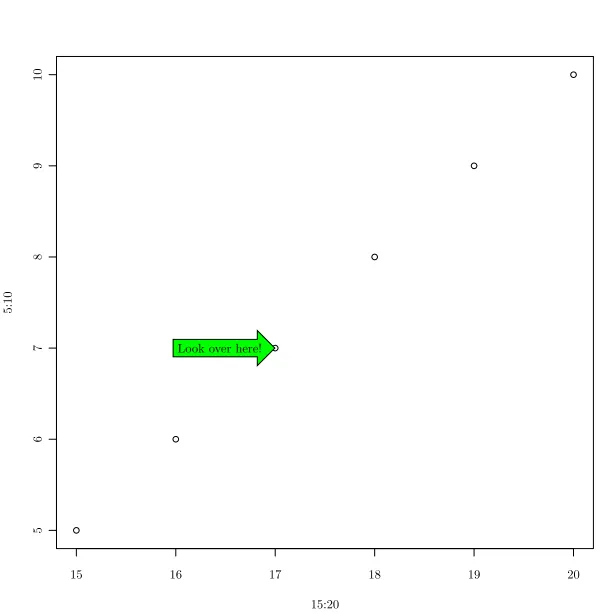
使用tikz在ggplot2图形上注释,在tikzDevice中注释

7
我想使用tikzDeviceLatex文档中包含带注释的ggplot2图形。 tikzAnnotate帮助文档提供了一个如何在基础图形中使用它的示例,但是如何与基于网格的绘图包ggplot2一起使用呢?挑战似乎在于tikz节点的定位。 playwith包中有一个函数convertToDevicePixels (http://code.google.com/p/playwith/source/browse/trunk/R/gridwork.R),类似于grconvertX/grconvertY,但我也无法使其工作。希望能得到任何关于如何继续的指导。下面是tikzAnnotate在基础图形中的示例:
library(tikzDevice)
library(ggplot2)
options(tikzLatexPackages = c(getOption('tikzLatexPackages'),
                "\\usetikzlibrary{shapes.arrows}"))
tikz(standAlone=TRUE)

print(plot(15:20, 5:10))
#print(qplot(15:20, 5:10))

x <- grconvertX(17,,'device')
y <- grconvertY(7,,'device')
#px <- playwith::convertToDevicePixels(17, 7)
#x <- px$x
#y <- px$y

tikzAnnotate(paste('\\node[single arrow,anchor=tip,draw,fill=green] at (',
                x,',',y,') {Look over here!};'))
dev.off()

resulting image


你考虑过直接在ggplot()中使用geom_text进行注释吗? - Andrie
那是一个备选项。我更喜欢tikz,因为它允许使用各种形状。 - learnr
1
你会觉得在ggplot中结合geom_text和geom_polygon的示例有用吗? - Andrie
嗯,那可能是解决这个问题的另一种方法... 是的,一个例子会很有用。 - learnr
我根据@Andrie在二月份的建议编写了一个示例,尽管我刚刚意识到我上次附加的图片不知怎么消失了。我已经重新上传了它,希望它能有所帮助。 - daroczig
2个回答

8
目前,tikzAnnotate仅适用于基本图形。当tikzAnnotate首次编写时,与grid图形的问题在于我们需要一种指定相对于设备画布的绝对左下角的x、y坐标的方法。grid以视口为单位进行思考,对于许多情况来说,似乎只有当它通过print函数传送到设备时,才会知道图形的最终坐标系。
拥有这个功能将是很棒的,但我无法找到一个好的实现方式,因此这个功能被搁置了。如果有人对一个好的实现方式有详细信息,请随时在邮件列表上开始讨论(现在在Google Groups上有一个备用门户),它将被列入待办事项清单。
更好的方法是实现这个功能,并在GitHub上打开一个拉取请求。这可以确保比如果它在我的待办事项清单上放置几个月后发布要快9000倍以上。

更新

我有一些时间来处理这个问题,并想出了一个函数,用于将当前视口中的网格坐标转换为绝对设备坐标:

gridToDevice <- function(x = 0, y = 0, units = 'native') {
  # Converts a coordinate pair from the current viewport to an "absolute
  # location" measured in device units from the lower left corner. This is done
  # by first casting to inches in the current viewport and then using the
  # current.transform() matrix to obtain inches in the device canvas.
  x <- convertX(unit(x, units), unitTo = 'inches', valueOnly = TRUE)
  y <- convertY(unit(y, units), unitTo = 'inches', valueOnly = TRUE)

  transCoords <- c(x,y,1) %*% current.transform()
  transCoords <- (transCoords / transCoords[3])

  return(
    # Finally, cast from inches to native device units
    c(
      grconvertX(transCoords[1], from = 'inches', to ='device'),
      grconvertY(transCoords[2], from = 'inches', to ='device')
    )
  )

}

使用这个缺失的部分,可以使用tikzAnnotate对一个grid或者lattice图进行标记:

require(tikzDevice)
require(grid)
options(tikzLatexPackages = c(getOption('tikzLatexPackages'),
                "\\usetikzlibrary{shapes.arrows}"))

tikz(standAlone=TRUE)

xs <- 15:20
ys <- 5:10

pushViewport(plotViewport())
pushViewport(dataViewport(xs,ys))

grobs <- gList(grid.rect(),grid.xaxis(),grid.yaxis(),grid.points(xs, ys))

coords <- gridToDevice(17, 7)
tikzAnnotate(paste('\\node[single arrow,anchor=tip,draw,fill=green,left=1em]',
  'at (', coords[1],',',coords[2],') {Look over here!};'))

dev.off()

这将产生以下输出:

TikZ Annotation of Grid Graphics


还有一些工作要做,例如:

  • 创建一个可以添加到网格图形中的“注释grob”。

  • 确定如何将此对象添加到ggplot中。

这些功能已经被安排在tikzDevice的0.7版本中发布


2

我根据 @Andrie 的建议制作了一个小例子,使用 geom_textgeom_polygon

初始化数据:

df <- structure(list(x = 15:20, y = 5:10), .Names = c("x", "y"), row.names = c(NA, -6L), class = "data.frame")

您需要注释的是数据集中的第4行,文本应为:“看这里!”

point <- df[4,]
ptext <- "Look over here!"

根据上面给出的坐标计算出一个漂亮的箭头:

arrow <- data.frame(
    x = c(point$x-0.1, point$x-0.3, point$x-0.3, point$x-2, point$x-2, point$x-0.3, point$x-0.3, point$x-0.1),
    y = c(point$y, point$y+0.3, point$y+0.2, point$y+0.2, point$y-0.2, point$y-0.2, point$y-0.3, point$y)
)

同时还要为文本的位置进行一些计算:

ptext <- data.frame(label=ptext, x=point$x-1, y=point$y)

除了绘图,没有其他事情要做:

ggplot(df, aes(x,y)) + geom_point() + geom_polygon(aes(x,y), data=arrow, fill="green") + geom_text(aes(x, y, label=label), ptext) + theme_bw()

使用箭头符号注释ggplot2的示例图像

当然,这是一种相当hackish的解决方案,但可以扩展:

  • 根据xy范围计算箭头的大小,
  • 根据文本长度(或使用textGrob实际宽度)计算文本位置,
  • 定义一个不会重叠您点的形状:)

祝好运!


网页内容由stack overflow 提供, 点击上面的
可以查看英文原文,
原文链接