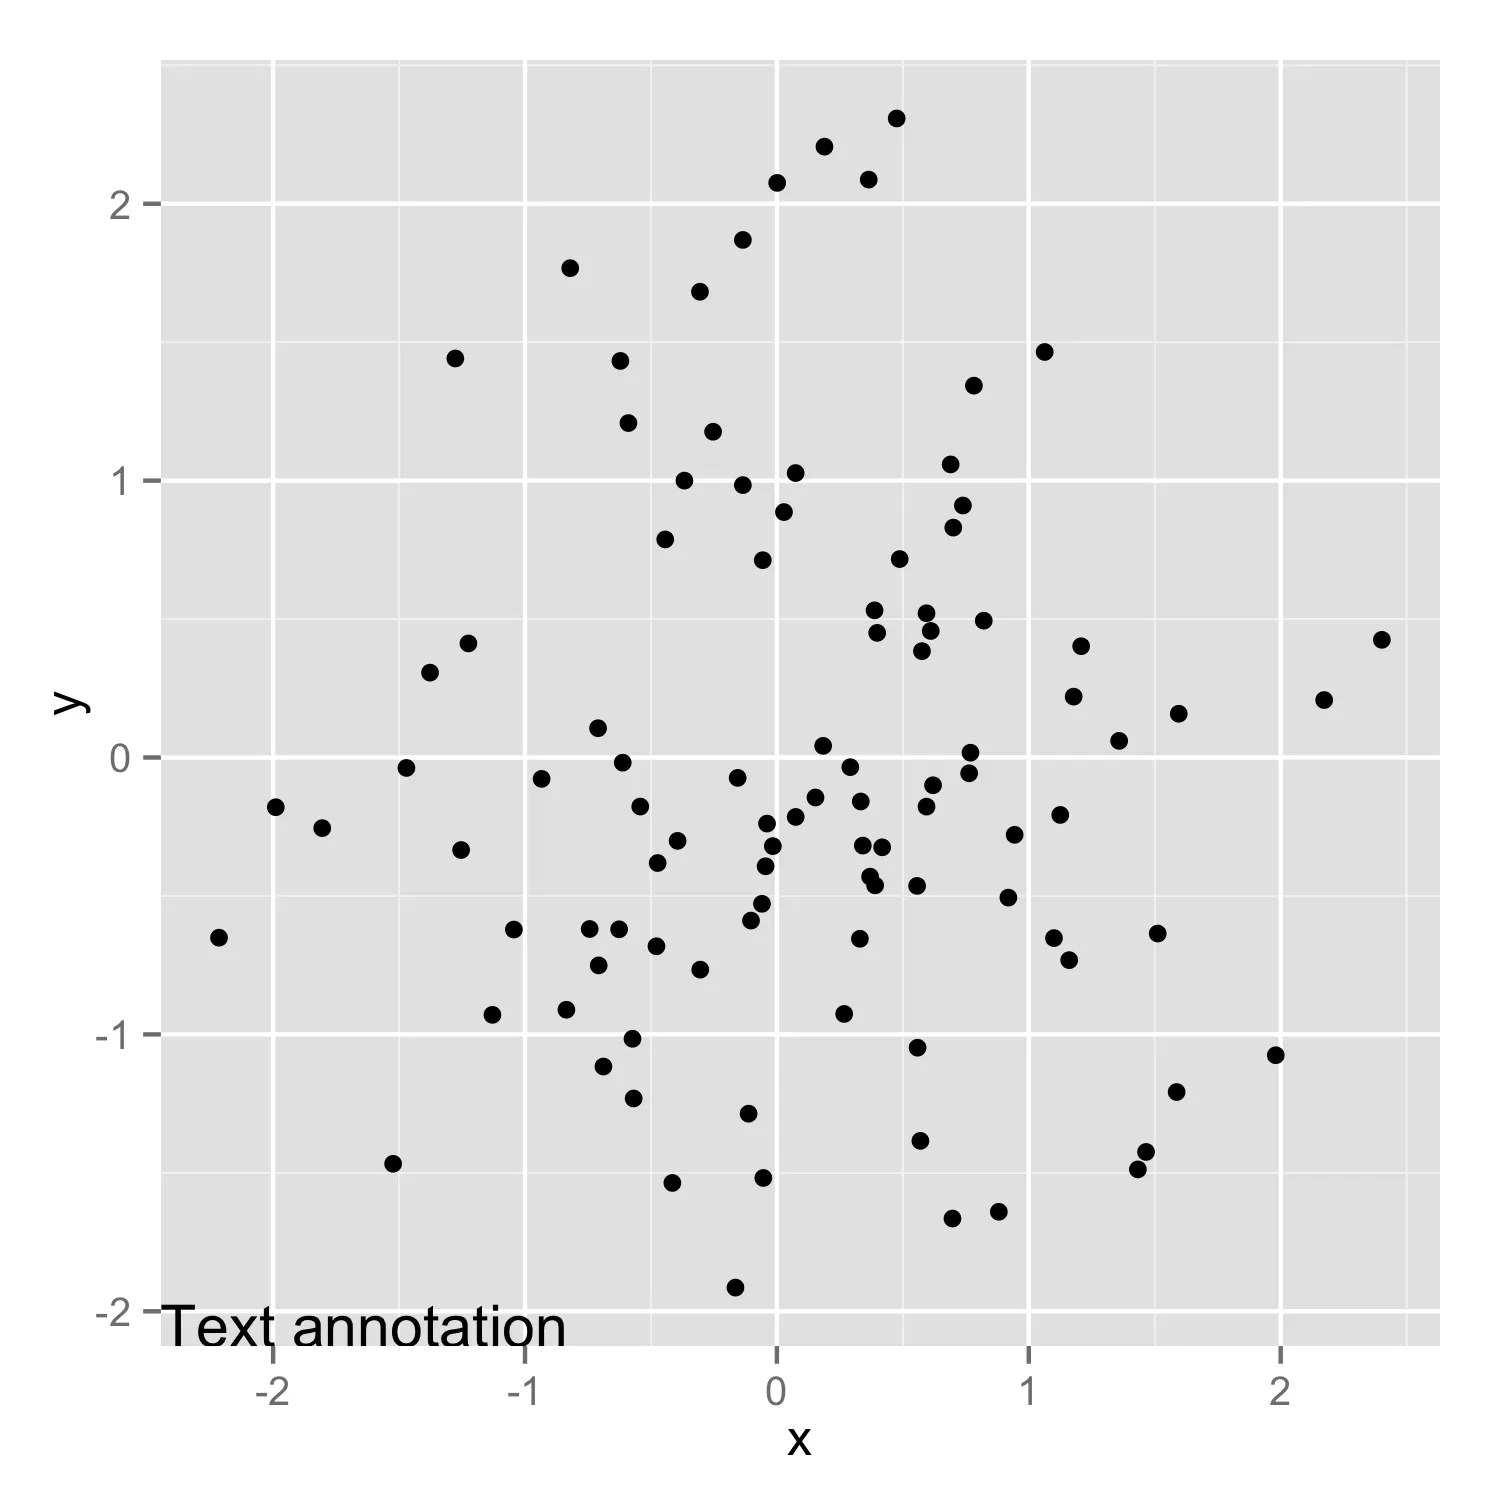
"Inf" 解决方案在处理多行文本时存在问题。此外,文本和面板边缘之间没有间距,很不美观。另一个解决方案需要显式提及数据,这也不好。使用 annotation_custom (或者像我例子中的 proto Geom 一样) 可以很好地实现所需效果。你可以配置边距、文本和框对齐方式。以下代码的额外奖励是,你可以指定要注释的 facet,例如
facets=data.frame(cat1='blue', cat2='tall')。"
library("ggplot2")
annotate_textp <- function(label, x, y, facets=NULL, hjust=0, vjust=0, color='black', alpha=NA,
                          family=thm$text$family, size=thm$text$size, fontface=1, lineheight=1.0,
                          box_just=ifelse(c(x,y)<0.5,0,1), margin=unit(size/2, 'pt'), thm=theme_get()) {
  x <- scales::squish_infinite(x)
  y <- scales::squish_infinite(y)
  data <- if (is.null(facets)) data.frame(x=NA) else data.frame(x=NA, facets)

  tg <- grid::textGrob(
    label, x=0, y=0, hjust=hjust, vjust=vjust,
    gp=grid::gpar(col=alpha(color, alpha), fontsize=size, fontfamily=family, fontface=fontface, lineheight=lineheight)
  )
  ts <- grid::unit.c(grid::grobWidth(tg), grid::grobHeight(tg))
  vp <- grid::viewport(x=x, y=y, width=ts[1], height=ts[2], just=box_just)
  tg <- grid::editGrob(tg, x=ts[1]*hjust, y=ts[2]*vjust, vp=vp)
  inner <- grid::grobTree(tg, vp=grid::viewport(width=unit(1, 'npc')-margin*2, height=unit(1, 'npc')-margin*2))

  layer(
    data = NULL,
    stat = StatIdentity,
    position = PositionIdentity,
    geom = GeomCustomAnn,
    inherit.aes = TRUE,
    params = list(
      grob=grid::grobTree(inner),
      xmin=-Inf,
      xmax=Inf,
      ymin=-Inf,
      ymax=Inf
    )
  )
}

qplot(1:10,1:10) + annotate_text2('some long text\nx = 1', x=0.5, y=0.5, hjust=1)