如何在ggplot2中绘制nls模型拟合的输出

3

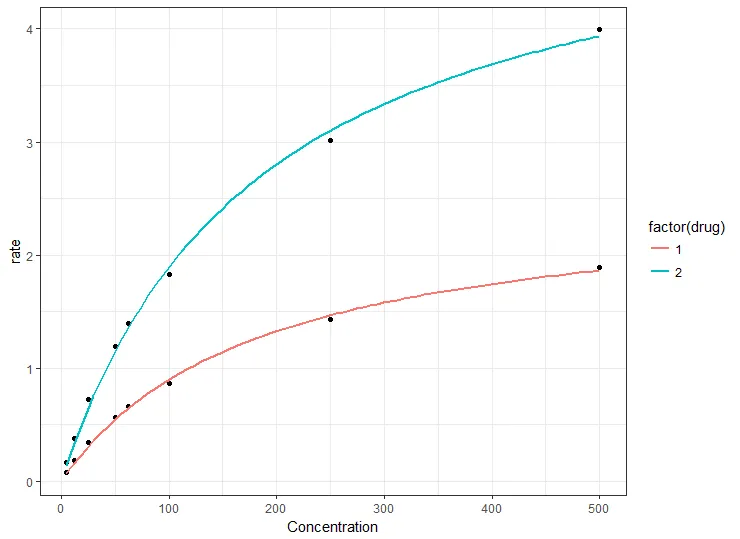
我有一些数据,我想使用nls对数据的每个子集拟合非线性模型,然后使用ggplot2将拟合的模型叠加到数据点的图形上。具体来说,模型的形式为

y~V*x/(K+x)

你可能会认识它,它被称为Michaelis-Menten。一种方法是使用geom_smooth,但如果我使用geom_smooth,我就没有办法检索模型拟合的系数。或者,我可以使用nls拟合数据,然后使用geom_smooth绘制拟合线,但是我怎么知道geom_smooth绘制的曲线与我的nls拟合给出的曲线相同?除非我可以让geom_smooth仅使用数据的子集,然后指定起始参数,否则我无法将nls拟合的系数传递给geom_smooth并告诉它使用它们。但是,每次我尝试都会出现以下错误:

Aesthetics must be either length 1 or the same as the data (8): x, y, colour

这是我一直在使用的一些虚构数据样例:

Concentration <- c(500.0,250.0,100.0,62.5,50.0,25.0,12.5,5.0,
                   500.0,250.0,100.0,62.5,50.0,25.0,12.5,5.0)

drug <- c(1,1,1,1,1,1,1,1,2,2,2,2,2,2,2,2)

rate <- c(1.889220,1.426500,0.864720,0.662210,0.564340,0.343140,0.181120,0.077170,
          3.995055,3.011800,1.824505,1.397237,1.190078,0.723637,0.381865,0.162771)

file<-data.frame(Concentration,drug,rate)

在我的图表中,浓度将是x,速率将是y;药品将是颜色变量。如果我写下以下内容,就会出现错误:

plot <- ggplot(file,aes(x=file[,1],y=file[,3],color=Compound))+geom_point()

plot<-plot+geom_smooth(data=subset(file,file[,2]==drugNames[i]),method.args=list(formula=y~Vmax*x/(Km+x),start=list(Vmax=coef(models[[i]])[1],Km=coef(models[[i]])[2])),se=FALSE,size=0.5)

其中models[[]]是由nls返回的模型参数列表。

有什么想法可以在geom_smooth中对数据框进行子集处理,以便我可以使用nls拟合的起始参数单独绘制曲线?


1
可能是ggplot2带有多个参数的绘图函数的重复问题。 - Maurits Evers
1
虽然无关紧要,但plotfile作为变量名称并不是明智的选择(这些名称已经被函数占用)。 - neilfws
1
同时,如果能够查看生成“models”代码,将会有所帮助。 - neilfws
我还注意到你的示例数据变量与代码不匹配:例如,drug、Compound、drugNames都被使用了。 - neilfws
我认为你会发现这些帖子很有帮助:使用R进行酶动力学使用ggplot绘制两个酶图 - neilfws
1个回答

9
理想的解决方案是使用ggplot绘制nls()结果,但这里有一个“快速而简单”的解决方案,基于一些观察结果。
首先,如果您对nls()geom_smooth(method = "nls")使用相同的公式,那么您将得到相同的系数。这是因为后者在调用前者。
其次,使用您的示例数据,nls()收敛到Vmax和Km的相同值(每种药物不同),无论起始值如何。换句话说,没有必要使用每个单独药物的起始值范围构建模型。以下任何一种方法都会为药物1(以及类似地为药物2)给出相同的结果:
library(dplyr)
# use maximum as start
df1 %>% 
  filter(drug == 1) %>% 
  nls(rate ~ Vm * Concentration/(K + Concentration), 
      data = ., 
      start = list(K = max(.$Concentration), Vm = max(.$rate)))

# use minimum as start
df1 %>% 
  filter(drug == 1) %>% 
  nls(rate ~ Vm * Concentration/(K + Concentration), 
      data = ., 
      start = list(K = min(.$Concentration), Vm = min(.$rate)))

# use arbitrary values as start
df1 %>% 
  filter(drug == 1) %>% 
  nls(rate ~ Vm * Concentration/(K + Concentration), 
      data = ., 
      start = list(K = 50, Vm = 2))

所以最快的绘制曲线的方法就是将药物映射到ggplot美学,例如颜色。这将构建来自相同起始值的单独的nls曲线,如果需要获得系数,则可以返回nls(),并知道模型应与图形相同。
使用您的示例数据file(但不要称其为file,我使用了df1):
library(ggplot2)
df1 <- structure(list(Concentration = c(500, 250, 100, 62.5, 50, 25, 12.5, 5, 
                                        500, 250, 100, 62.5, 50, 25, 12.5, 5), 
                      drug = c(1, 1, 1, 1, 1, 1, 1, 1, 
                               2, 2, 2, 2, 2, 2, 2, 2), 
                      rate = c(1.88922, 1.4265, 0.86472, 0.66221, 0.56434, 0.34314, 
                               0.18112, 0.07717, 3.995055, 3.0118, 1.824505, 1.397237, 
                               1.190078, 0.723637, 0.381865, 0.162771)),
                      .Names = c("Concentration", "drug", "rate"), 
                      row.names = c(NA, -16L), 
                      class = "data.frame")

# could use e.g. Km = min(df1$Concentration) for start
# but here we use arbitrary values
ggplot(df1, aes(Concentration, rate)) + 
  geom_point() + 
  geom_smooth(method = "nls", 
              method.args = list(formula = y ~ Vmax * x / (Km + x),
                                 start = list(Km = 50, Vmax = 2)), 
              data = df1,
              se = FALSE,
              aes(color = factor(drug)))

enter image description here


谢谢!太完美了。抱歉我上面代码中的错误。 - HappyDog

网页内容由stack overflow 提供, 点击上面的
可以查看英文原文,
原文链接