我正在尝试将数据拟合到一个指数衰减函数(类似RC系统)的方程:
我的数据在以下数据框中:
dataset <- data.frame(Exp = c(4, 4, 4, 4, 4, 4, 4, 4, 4, 4, 4, 5, 5, 5, 5, 5, 5, 5, 5, 5, 5, 5, 6, 6, 6, 6, 6, 6, 6, 6, 6, 6, 6), t = c(0, 0.33, 0.67, 1, 1.33, 1.67, 2, 4, 6, 8, 10, 0, 33, 0.67, 1, 1.33, 1.67, 2, 4, 6, 8, 10, 0, 0.33, 0.67, 1, 1.33, 1.67, 2, 4, 6, 8, 10), fold = c(1, 0.957066345654286, 1.24139015724819, 1.62889151698633, 1.72008539595879, 1.82725412314402, 1.93164365299958, 1.9722929538061, 2.15842019312484, 1.9200507796933, 1.95804730344453, 1, 0.836176542548747, 1.07077717914707, 1.45471712491441, 1.61069357875771, 1.75576377806756, 1.89280913889538, 2.00219054189937, 1.87795513639311, 1.85242493827193, 1.7409346372629, 1, 0.840498729335292, 0.904130905000499, 1.23116185602517, 1.41897551928886, 1.60167656534099, 1.72389226836308, 1.80635095956481, 1.76640786872057, 1.74327897001172, 1.63581509884482))
我有三个实验(Exp: 4、5和6)的数据,我想要将每个实验拟合到给定的方程中。
我已经成功地对其中一个实验进行了操作,通过对我的数据进行子集化并使用由nls计算出的参数来完成。
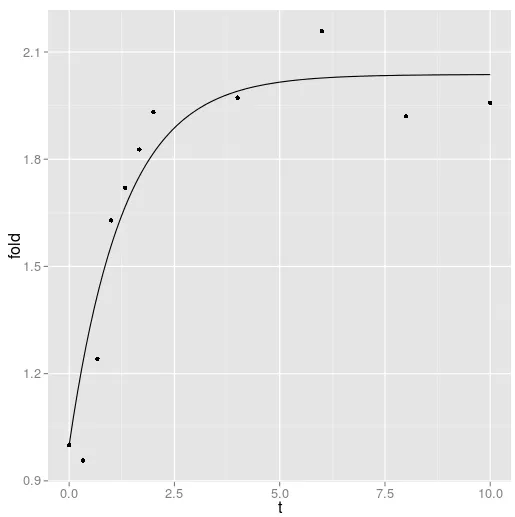
test <- subset(dataset,Exp==4)
fit1 = nls(fold ~ 1+(Vmax*(1-exp(-t/tau))),
  data=test,
  start=c(tau=0.2,Vmax=2))
ggplot(test,aes(t,fold))+
  stat_function(fun=function(t){1+coef(fit1)[[2]]*(1-exp(-t/coef(fit1)[[1]]))})+
  geom_point()
如果我尝试使用以下代码直接在完整数据集上使用geom_smooth函数:
d <- ggplot(test,aes(t,fold))+
   geom_point()+
   geom_smooth(method="nls",
     formula='fold~1+Vmax*(1-exp(-t/tau))',
     start=c(tau=0.2,Fmax=2))
print(d)
我遇到了以下错误:
Error in model.frame.default(formula = ~fold, data = data, weights = weight) :
  variable lengths differ (found for '(weights)')
In addition: Warning messages:
1: In min(x) : no non-missing arguments to min; returning Inf
2: In max(x) : no non-missing arguments to max; returning -Inf
我的语法有什么问题吗?我想让这个函数能够在数据集上使用,并使用分组来实现每个Exp级别的一次拟合。
start=c(tau=0.2,Vmax=2)пјЊдёЌиµ·дЅњз”ЁгЂ‚ж №жЌ®geom_smoothзљ„ж–‡жЎЈпјЊдЅ еЏЇд»Ґе°†start=c(tau=0.2,Vmax=2)дј йЂ’з»™method.argsпјЊдЅ†е®ѓд№џдёЌиµ·дЅњз”ЁгЂ‚ggplot 2.0.0- msakyase=FALSE是必要的。参见:https://dev59.com/VWvXa4cB1Zd3GeqPO_6M - msakyamethod.args = list(start=c(tau=0.2,Vmax=2))是完全正常的。 - Rolandmethod.args = list(start=c(tau=-1,Vmax=2))可以很好地拟合数据。 - David C.