很好的问题。
您还可以直接使用
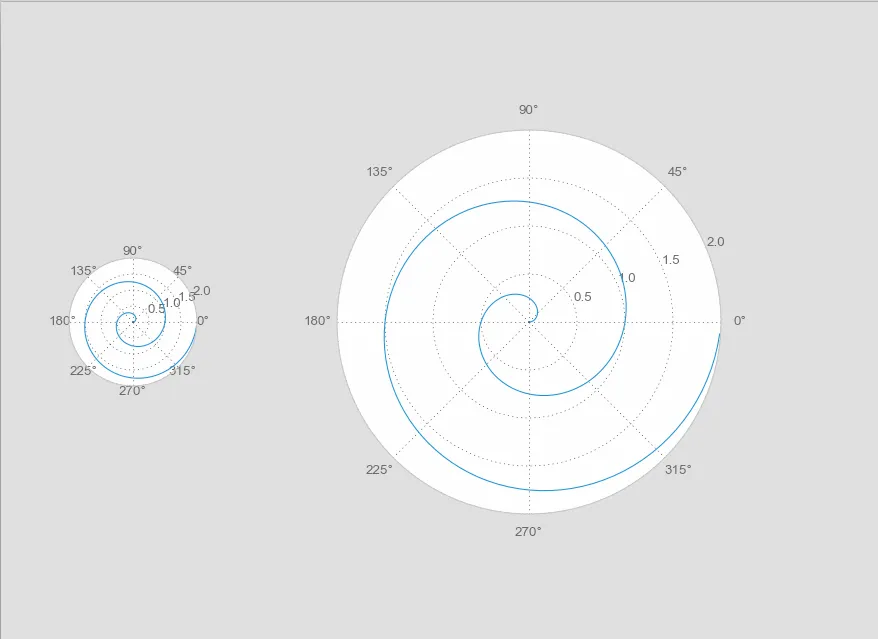
fig.add_axes()来获得一个连续的空间,在其中放置您的图表:
f = plt.figure()
ax = f.add_axes([0.05, 0.4, 0.2, 0.2], polar=True)
ax2 = f.add_axes([0.30, 0.2, 0.6, 0.6], polar=True)
r = np.arange(0, 2, 0.01)
theta = 2 * np.pi * r
ax.plot(theta, r)
ax2.plot(theta, r)
更好的版本
创建Axes时,您可以尝试设置不同的尺寸:
import numpy as np
import matplotlib.pyplot as plt

r = np.arange(0, 2, 0.01)
theta = 2 * np.pi * r

ax = plt.subplot2grid((2,3), (0,0), polar=True)
ax2 = plt.subplot2grid((2,3), (0,1), rowspan=2, colspan=2, polar=True)
ax.plot(theta, r)
ax2.plot(theta, r)
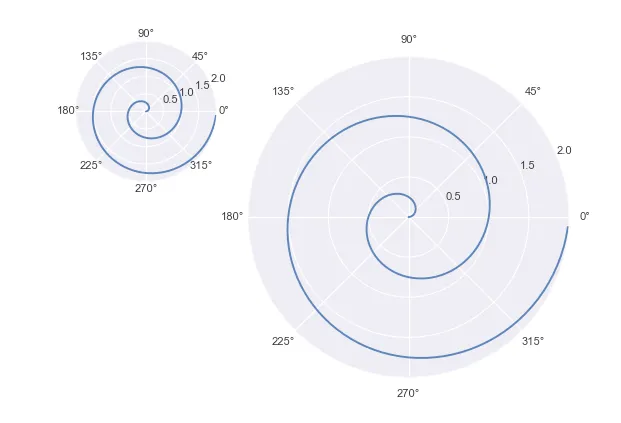
您可以拥有比2x3更大的网格,并且在绘图大小上具有更多细度。
(不要在意不同的图形风格)
希望对您有所帮助。