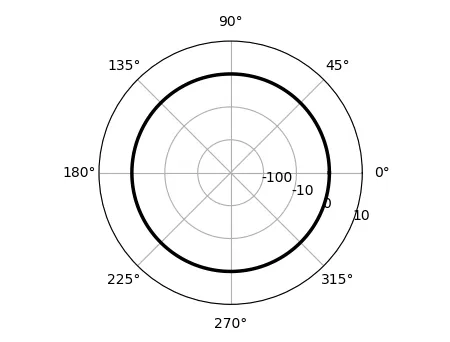
我正在尝试使用极坐标图来制作雷达图。我想知道如何将其中一条网格线加粗(而其他网格线应保持标准)。
对于我的特定情况,我想突出显示与ytick“0”相关联的网格线。
from matplotlib import pyplot as plt
import pandas as pd
import numpy as np
#Variables
sespi = pd.read_csv("country_progress.csv")
labels = sespi.country
progress = sespi.progress
angles=np.linspace(0, 2*np.pi, len(labels), endpoint=False)
#Concatenation to close the plots
progress=np.concatenate((progress,[progress[0]]))
angles=np.concatenate((angles,[angles[0]]))

#Polar plot
fig=plt.figure()
ax = fig.add_subplot(111, polar=True)
ax.plot(angles, progress, '.--', linewidth=1, c="g")
#ax.fill(angles, progress, alpha=0.25)
ax.set_thetagrids(angles * 180/np.pi, labels)
ax.set_yticklabels([-200,-150,-100,-50,0,50,100,150,200])
#ax.set_title()
ax.grid(True)
plt.show()