在scipy中,没有支持使用数据拟合负二项分布的函数(可能是因为在scipy中的负二项分布只是离散的)。对于正态分布,我只需执行以下操作:
from scipy.stats import norm
param = norm.fit(samp)
还有其他库中类似的“即用”函数吗?
from scipy.stats import norm
param = norm.fit(samp)
还有其他库中类似的“即用”函数吗?
这不仅是因为它是离散的,还因为负二项式的最大似然拟合可能非常复杂,特别是有额外位置参数的情况下。这就是为什么.fit()方法没有提供给它(以及其他在Scipy中的离散分布)的原因,以下是一个例子:
In [163]:
import scipy.stats as ss
import scipy.optimize as so
In [164]:
#define a likelihood function
def likelihood_f(P, x, neg=1):
n=np.round(P[0]) #by definition, it should be an integer
p=P[1]
loc=np.round(P[2])
return neg*(np.log(ss.nbinom.pmf(x, n, p, loc))).sum()
In [165]:
#generate a random variable
X=ss.nbinom.rvs(n=100, p=0.4, loc=0, size=1000)
In [166]:
#The likelihood
likelihood_f([100,0.4,0], X)
Out[166]:
-4400.3696690513316
In [167]:
#A simple fit, the fit is not good and the parameter estimate is way off
result=so.fmin(likelihood_f, [50, 1, 1], args=(X,-1), full_output=True, disp=False)
P1=result[0]
(result[1], result[0])
Out[167]:
(4418.599495886474, array([ 59.61196161, 0.28650831, 1.15141838]))
In [168]:
#Try a different set of start paramters, the fit is still not good and the parameter estimate is still way off
result=so.fmin(likelihood_f, [50, 0.5, 0], args=(X,-1), full_output=True, disp=False)
P1=result[0]
(result[1], result[0])
Out[168]:
(4417.1495981801972,
array([ 6.24809397e+01, 2.91877405e-01, 6.63343536e-04]))
In [169]:
#In this case we need a loop to get it right
result=[]
for i in range(40, 120): #in fact (80, 120) should probably be enough
_=so.fmin(likelihood_f, [i, 0.5, 0], args=(X,-1), full_output=True, disp=False)
result.append((_[1], _[0]))
In [170]:
#get the MLE
P2=sorted(result, key=lambda x: x[0])[0][1]
sorted(result, key=lambda x: x[0])[0]
Out[170]:
(4399.780263084549,
array([ 9.37289361e+01, 3.84587087e-01, 3.36856705e-04]))
In [171]:
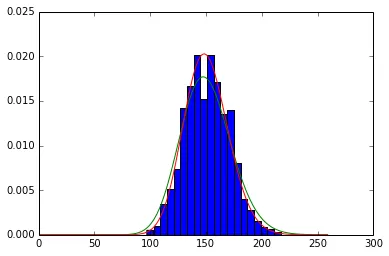
#Which one is visually better?
plt.hist(X, bins=20, normed=True)
plt.plot(range(260), ss.nbinom.pmf(range(260), np.round(P1[0]), P1[1], np.round(P1[2])), 'g-')
plt.plot(range(260), ss.nbinom.pmf(range(260), np.round(P2[0]), P2[1], np.round(P2[2])), 'r-')
Out[171]:
[<matplotlib.lines.Line2D at 0x109776c10>]
我知道这个帖子已经很老了,但是现在的读者可能想看看这个仓库,它是为了这个目的而创建的:https://github.com/gokceneraslan/fit_nbinom
这里也有一个实现,虽然它是一个较大软件包的一部分:https://github.com/ernstlab/ChromTime/blob/master/optimize.py
mu = np.mean(sample)
sigma_sqr = np.var(sample)

n = mu**2 / (sigma_sqr - mu)
p = mu / sigma_sqr
statsmodels的负二项式回归模型,并仅使用交互项。这将使用MLE找到离散参数alpha。# Data processing
import pandas as pd
import numpy as np
# Analysis models
import statsmodels.formula.api as smf
from scipy.stats import nbinom
def convert_params(mu, alpha):
"""
Convert mean/dispersion parameterization of a negative binomial to the ones scipy supports
Parameters
----------
mu : float
Mean of NB distribution.
alpha : float
Overdispersion parameter used for variance calculation.
See https://en.wikipedia.org/wiki/Negative_binomial_distribution#Alternative_formulations
"""
var = mu + alpha * mu ** 2
p = mu / var
r = mu ** 2 / (var - mu)
return r, p
# Generate sample data
n = 2
p = 0.9
sample = nbinom.rvs(n=n, p=p, size=10000)
# Estimate parameters
## Mean estimates expectation parameter for negative binomial distribution
mu = np.mean(sample)
## Dispersion parameter from nb model with only interaction term
nbfit = smf.negativebinomial("nbdata ~ 1", data=pd.DataFrame({"nbdata": sample})).fit()
alpha = nbfit.params[1] # Dispersion parameter
# Convert parameters to n, p parameterization
n_est, p_est = convert_params(mu, alpha)
# Check that estimates are close to the true values:
print("""
{:<3} {:<3}
True parameters: {:<3} {:<3}
Estimates : {:<3} {:<3}""".format('n', 'p', n, p,
np.round(n_est, 2), np.round(p_est, 2)))