在Python中创建圆形类型的饼图子图

3

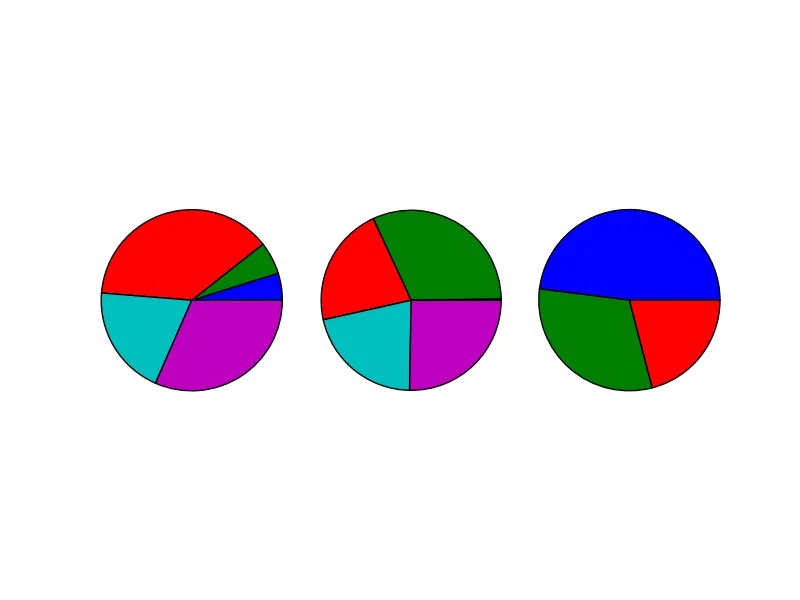
我正在尝试使用DF创建一个包含饼图的子图。但是,所有的饼图都不是真正的圆形,而是前两个呈椭圆形。请指导我如何使所有的子图大小相同且为圆形。

以下是我正在使用的代码:

fig = plt.figure()
ax1 = plt.subplot(131)
ax2 = plt.subplot(132)
ax3 = plt.subplot(133)

ax1 = test1_pie.plot(kind='pie',y=test1,ax =ax1)
plt.axis('equal')

ax2 = test2_pie.plot(kind='pie',y=test2,ax=ax2)
plt.axis('equal')

ax3 = test3_pie.plot(kind='pie',y=test3,ax=ax3)
plt.axis('equal')

请尝试使用 pie 函数,并发布一个完整的代码以重现此问题。 - Azad
@Azad,为特定的情节类型打标签可能会产生更多的噪音,而不是真正有所帮助。作为一个经验法则,我只会添加那些你可以想象人们实际选择的标签。 - cel
@cel 好的,你是对的。 - Azad
1
@MoChen,您可能需要为我们提供一个 [mcve]。 - cel
1个回答

1

我建议不要混合使用状态机pyplot调用和普通的轴方法调用,这是一个典型的例子。

plt.<whatever>在这种情况下将引用最后创建的轴对象。你只在最后一个轴对象上调用了axis('equal')

最好还是坚持使用普通的轴方法API。

例如:

fig = plt.figure()
ax1 = plt.subplot(131)
ax2 = plt.subplot(132)
ax3 = plt.subplot(133)

ax1 = test1_pie.plot(kind='pie', y=test1, ax=ax1)
ax1.axis('equal')

ax2 = test2_pie.plot(kind='pie', y=test2, ax=ax2)
ax2.axis('equal')

ax3 = test3_pie.plot(kind='pie', y=test3, ax=ax3)
ax3.axis('equal')

作为独立的示例:
import numpy as np
import matplotlib.pyplot as plt

fig, axes = plt.subplots(ncols=3)

for ax in axes:
    x = np.random.random(np.random.randint(3, 6))
    ax.pie(x)
    ax.axis('equal')

plt.show()

enter image description here


网页内容由stack overflow 提供, 点击上面的
可以查看英文原文,
原文链接