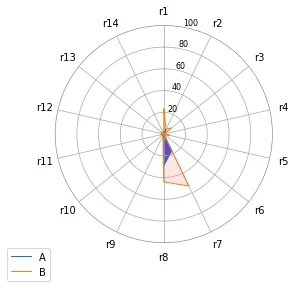
我想在Python中生成一个带有14个单独类别或“比萨片”饼形雷达/蜘蛛图。类似于Excel中创建的此示例或使用ggplot2创建的此示例。
这个plt示例很有用(下面是代码),但是不同类别的观测值通过线连接在一起,而不是拥有它们自己的独立部分(“比萨片”)。有什么想法在Python中如何实现呢?
import matplotlib.pyplot as plt
import pandas as pd
from math import pi

df = pd.DataFrame({
'group': ['A','B'],
'r1': [2, 23],
'r2': [5, 5],
'r3': [1, 9],
'r4': [1, 1],
'r5': [3, 6],
'r6': [0, 0],
'r7': [17, 53],
'r8': [29, 44],
'r9': [0,2],
'r10': [0, 2],
'r11': [0, 3],
'r12': [1, 2],
'r13': [0, 3],
'r14': [0, 0],
})

categories=list(df)[1:]
N = len(categories)
angles = [n / float(N) * 2 * pi for n in range(N)]
angles += angles[:1]
fig = plt.figure(figsize=(6,6))
ax = plt.subplot(111, polar=True)
ax.set_theta_offset(pi / 2)
ax.set_theta_direction(-1)
plt.xticks(angles[:-1], categories)#, rotation=70)

# Draw ylabels
ax.set_rlabel_position(10)
plt.yticks([20,40,60,80,100], ["20","40","60","80","100"], color="black", size=8)
plt.ylim(0,100)

values=df.loc[0].drop('group').values.flatten().tolist()
values += values[:1]
ax.plot(angles, values, linewidth=1, linestyle='solid', label="A")
ax.fill(angles, values, 'b', alpha=0.7)

values=df.loc[1].drop('group').values.flatten().tolist()
values += values[:1]
ax.plot(angles, values, linewidth=1, linestyle='solid', label="B")
ax.fill(angles, values, 'r', alpha=0.1)
plt.legend(loc='upper right', bbox_to_anchor=(0, 0))
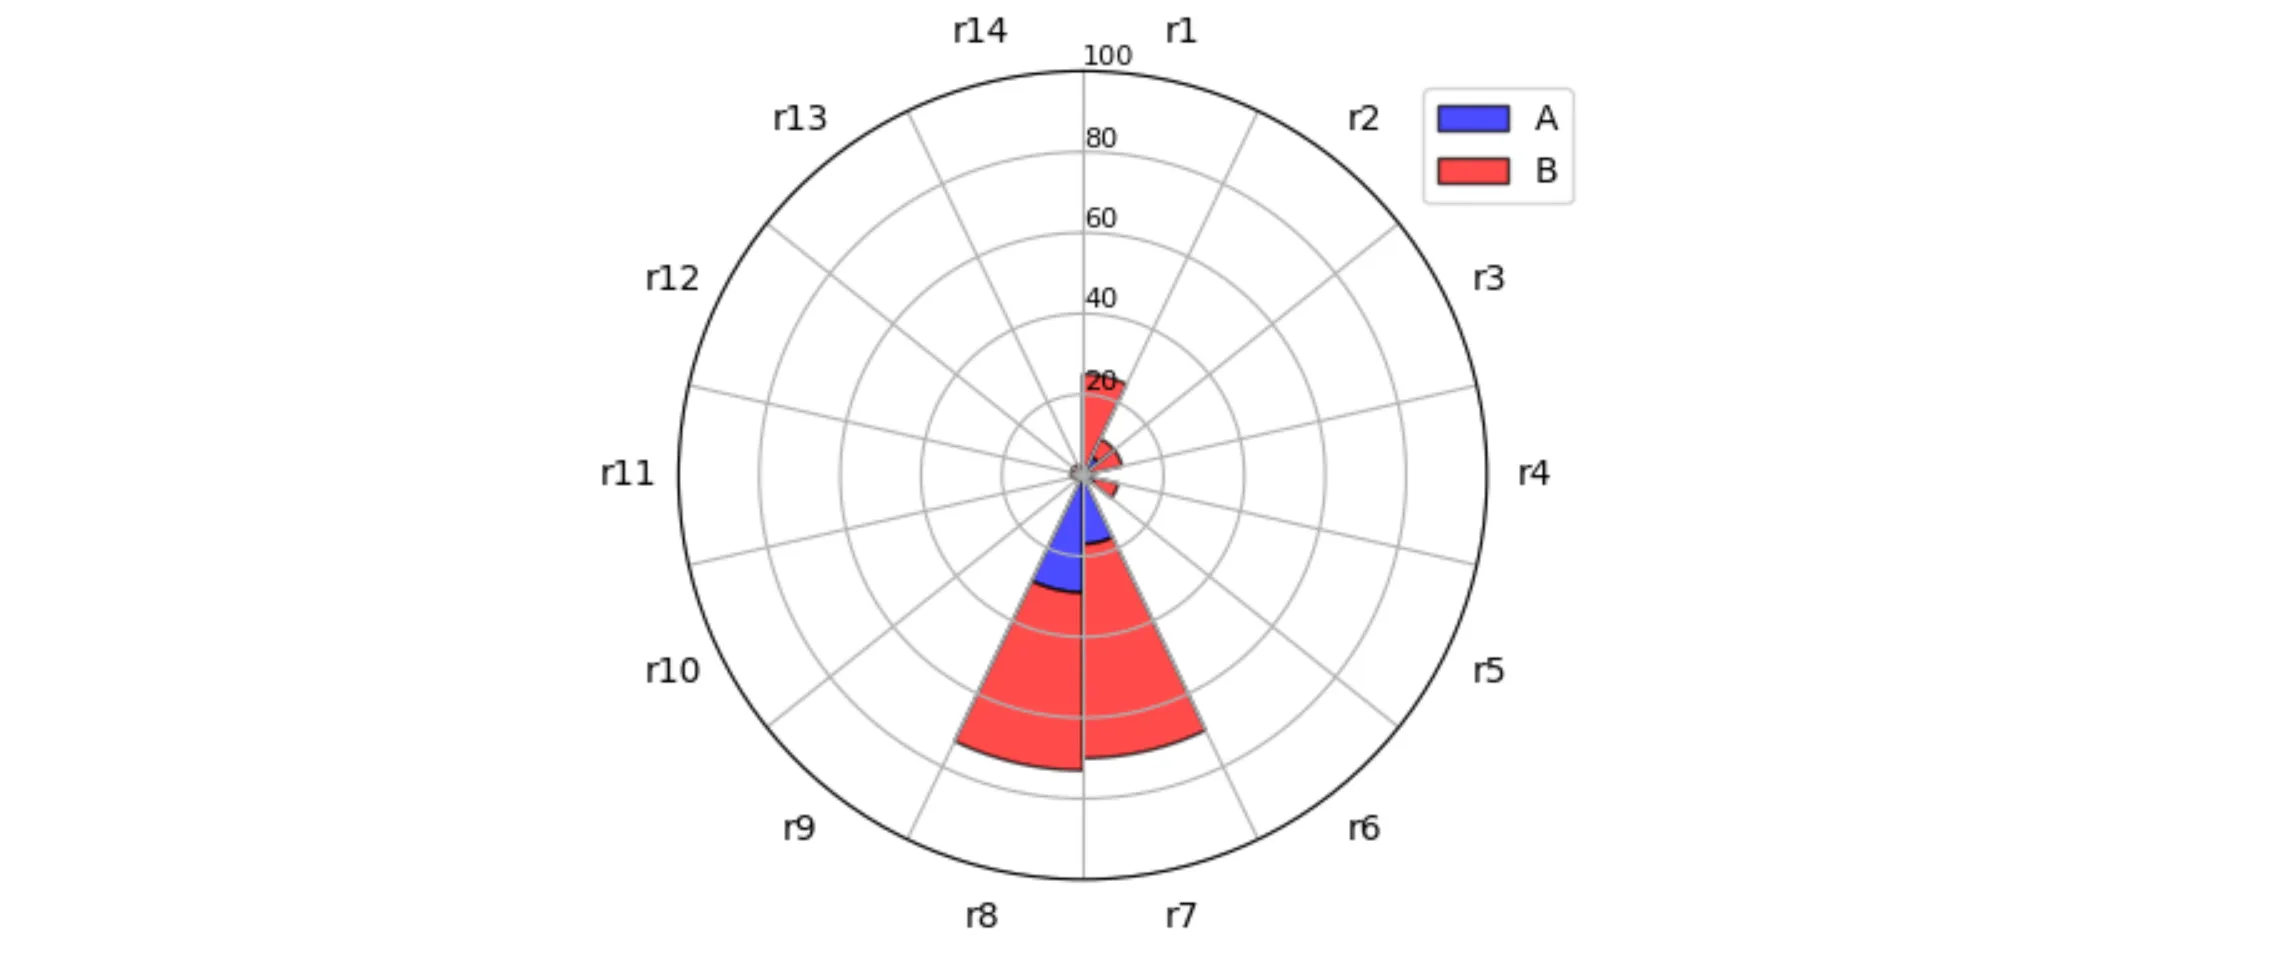
ax.bar(angles_mids, values1, bottom=values0, width=angles[1] - angles[0], facecolor='r', alpha=0.7, edgecolor='k', linewidth=1, label="B")- user1442363