我发布了自己的解决方案作为答案,以防有人需要它。
library(ggplot2)
library(gtable)
library(grid)
df1 <- expand.grid(list(x = 1:10, z = 1:4, col = 1:2))
df2 <- df1
df1$y <- df1$x * df1$x + df1$col * 10
df2$y <- 4 * df2$x + df1$col * 10
p1 <- ggplot(df1)
p1 <- p1 + geom_point(aes(x, y, colour = factor(col)))
p1 <- p1 + facet_wrap(~z)
p1 <- p1 + ylab('Y label for figure 1')
p1 <- p1 + theme(legend.position = 'bottom',
plot.margin = unit(c(1, 2, 0.5, 0.5), 'cm'))
p2 <- ggplot(df2)
p2 <- p2 + geom_line(aes(x, y, colour = factor(col)))
p2 <- p2 + facet_wrap(~z)
p2 <- p2 + ylab('Y label for figure 2')
p2 <- p2 + theme(legend.position = 'bottom',
plot.margin = unit(c(1, 2, 0.5, 0.5), 'cm'))
g1 <- ggplot_gtable(ggplot_build(p1))
g2 <- ggplot_gtable(ggplot_build(p2))
combo_grob <- g2
pos <- length(combo_grob) - 1
combo_grob$grobs[[pos]] <- cbind(g1$grobs[[pos]],
g2$grobs[[pos]], size = 'first')
panel_num <- length(unique(df1$z))
for (i in seq(panel_num))
{
panel_grob <- getGrob(g1$grobs[[i + 1]], 'geom_point.points',
grep = TRUE, global = TRUE)
combo_grob$grobs[[i + 1]] <- addGrob(combo_grob$grobs[[i + 1]],
panel_grob)
}
pos_a <- grep('axis_l', names(g1$grobs))
axis <- g1$grobs[pos_a]
for (i in seq(along = axis))
{
if (i %in% c(2, 4))
{
pp <- c(subset(g1$layout, name == paste0('panel-', i), se = t:r))
ax <- axis[[1]]$children[[2]]
ax$widths <- rev(ax$widths)
ax$grobs <- rev(ax$grobs)
ax$grobs[[1]]$x <- ax$grobs[[1]]$x - unit(1, "npc") + unit(0.5, "cm")
ax$grobs[[2]]$x <- ax$grobs[[2]]$x - unit(1, "npc") + unit(0.8, "cm")
combo_grob <- gtable_add_cols(combo_grob, g2$widths[g2$layout[pos_a[i],]$l], length(combo_grob$widths) - 1)
combo_grob <- gtable_add_grob(combo_grob, ax, pp$t, length(combo_grob$widths) - 1, pp$b)
}
}
pp <- c(subset(g1$layout, name == 'ylab', se = t:r))
ia <- which(g1$layout$name == "ylab")
ga <- g1$grobs[[ia]]
ga$rot <- 270
ga$x <- ga$x - unit(1, "npc") + unit(1.5, "cm")
combo_grob <- gtable_add_cols(combo_grob, g2$widths[g2$layout[ia,]$l], length(combo_grob$widths) - 1)
combo_grob <- gtable_add_grob(combo_grob, ga, pp$t, length(combo_grob$widths) - 1, pp$b)
combo_grob$layout$clip <- "off"
grid.draw(combo_grob)
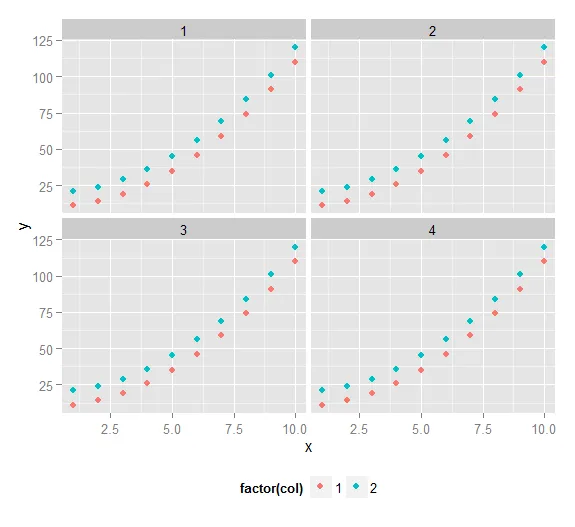
P1:
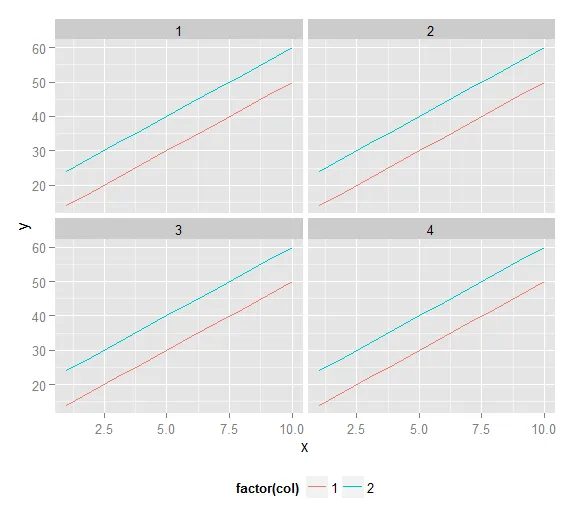
P2:
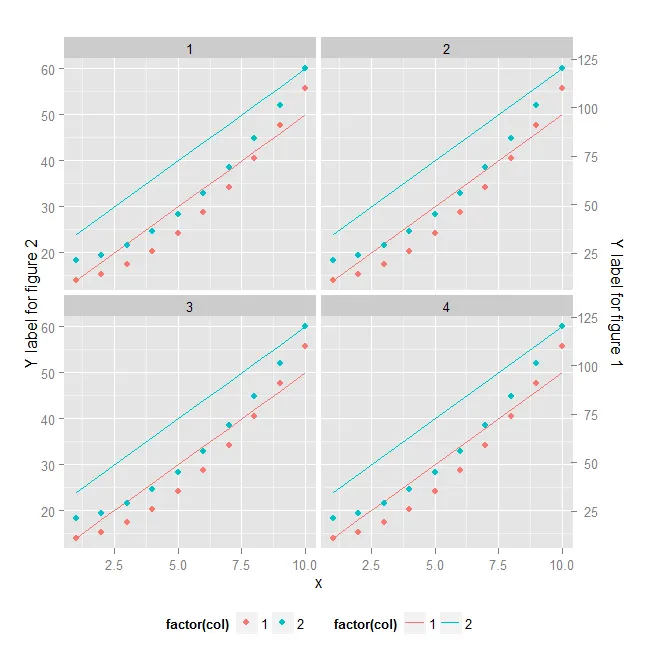
合并后: